H3 allows us to help make sense of large amounts of data. For this blog series, we will use the NYC Taxi Data set and add in the NYC Taxi Zones, New York Counties, NYC Boroughs and NYC Buildings. I also added in Open Street Map POI data using the Python notebook from my colleague Will Lyon. All of this data is publicly available.
Data Description
The NYC Taxi Data set covers four years of taxi operations in New York City and includes 697,622,444 trips. Each trip record contains a pickup location, pickup date and time, dropoff location and dropoff date and time. There are some other fields in the dataset but these are the fields of interest. In the last couple of years, the NYC Taxi Data set has changed so the pickup and dropoff locations are Taxi Zones and not actual latitude/longitude locations. We are using a dataset that still had the latitude/longitude values for the dropoff and pickup points.
The Taxi Zones, Counties and Boroughs contain the GeoJson representation for each polygon / Multipolygon.
H3 Hierarchy
H3 is a hierarchical geospatial index. As such, it contains a resolution hierarchy from 0-15 with 0 being the largest resolution and coverage area and 15 being the smallest resolution.
We will need to think through how to translate the Trip data and the polygons to an appropriate resolution to make sure we accurately locate the trip details as well as for the polygons. Some of this will be trial and error and some will be looking at what others have done to see what makes sense.
Databricks chose a resolution of 15 for the trip data. For our testing, we will use a resolution of 14. For the Taxi Zones, Counties and Boroughs, we are going to start with a resolution of 10. This should give a good balance between the accuracy of the hexes within the polygon and the number of hexes per geometry.
Modeling the Hierarchy
For our initial approach, we are going to model the H3 hierarchy by going from Resolution 14 -> Resolution 12 -> Resolution 10. We are going to skip Resolution 13 and Resolution 11 for now. It may change after we run some experiments but for now we think this will work fine for the queries that we are running.
Initial Neo4j Data Model
My first go at the data model looks like the following:
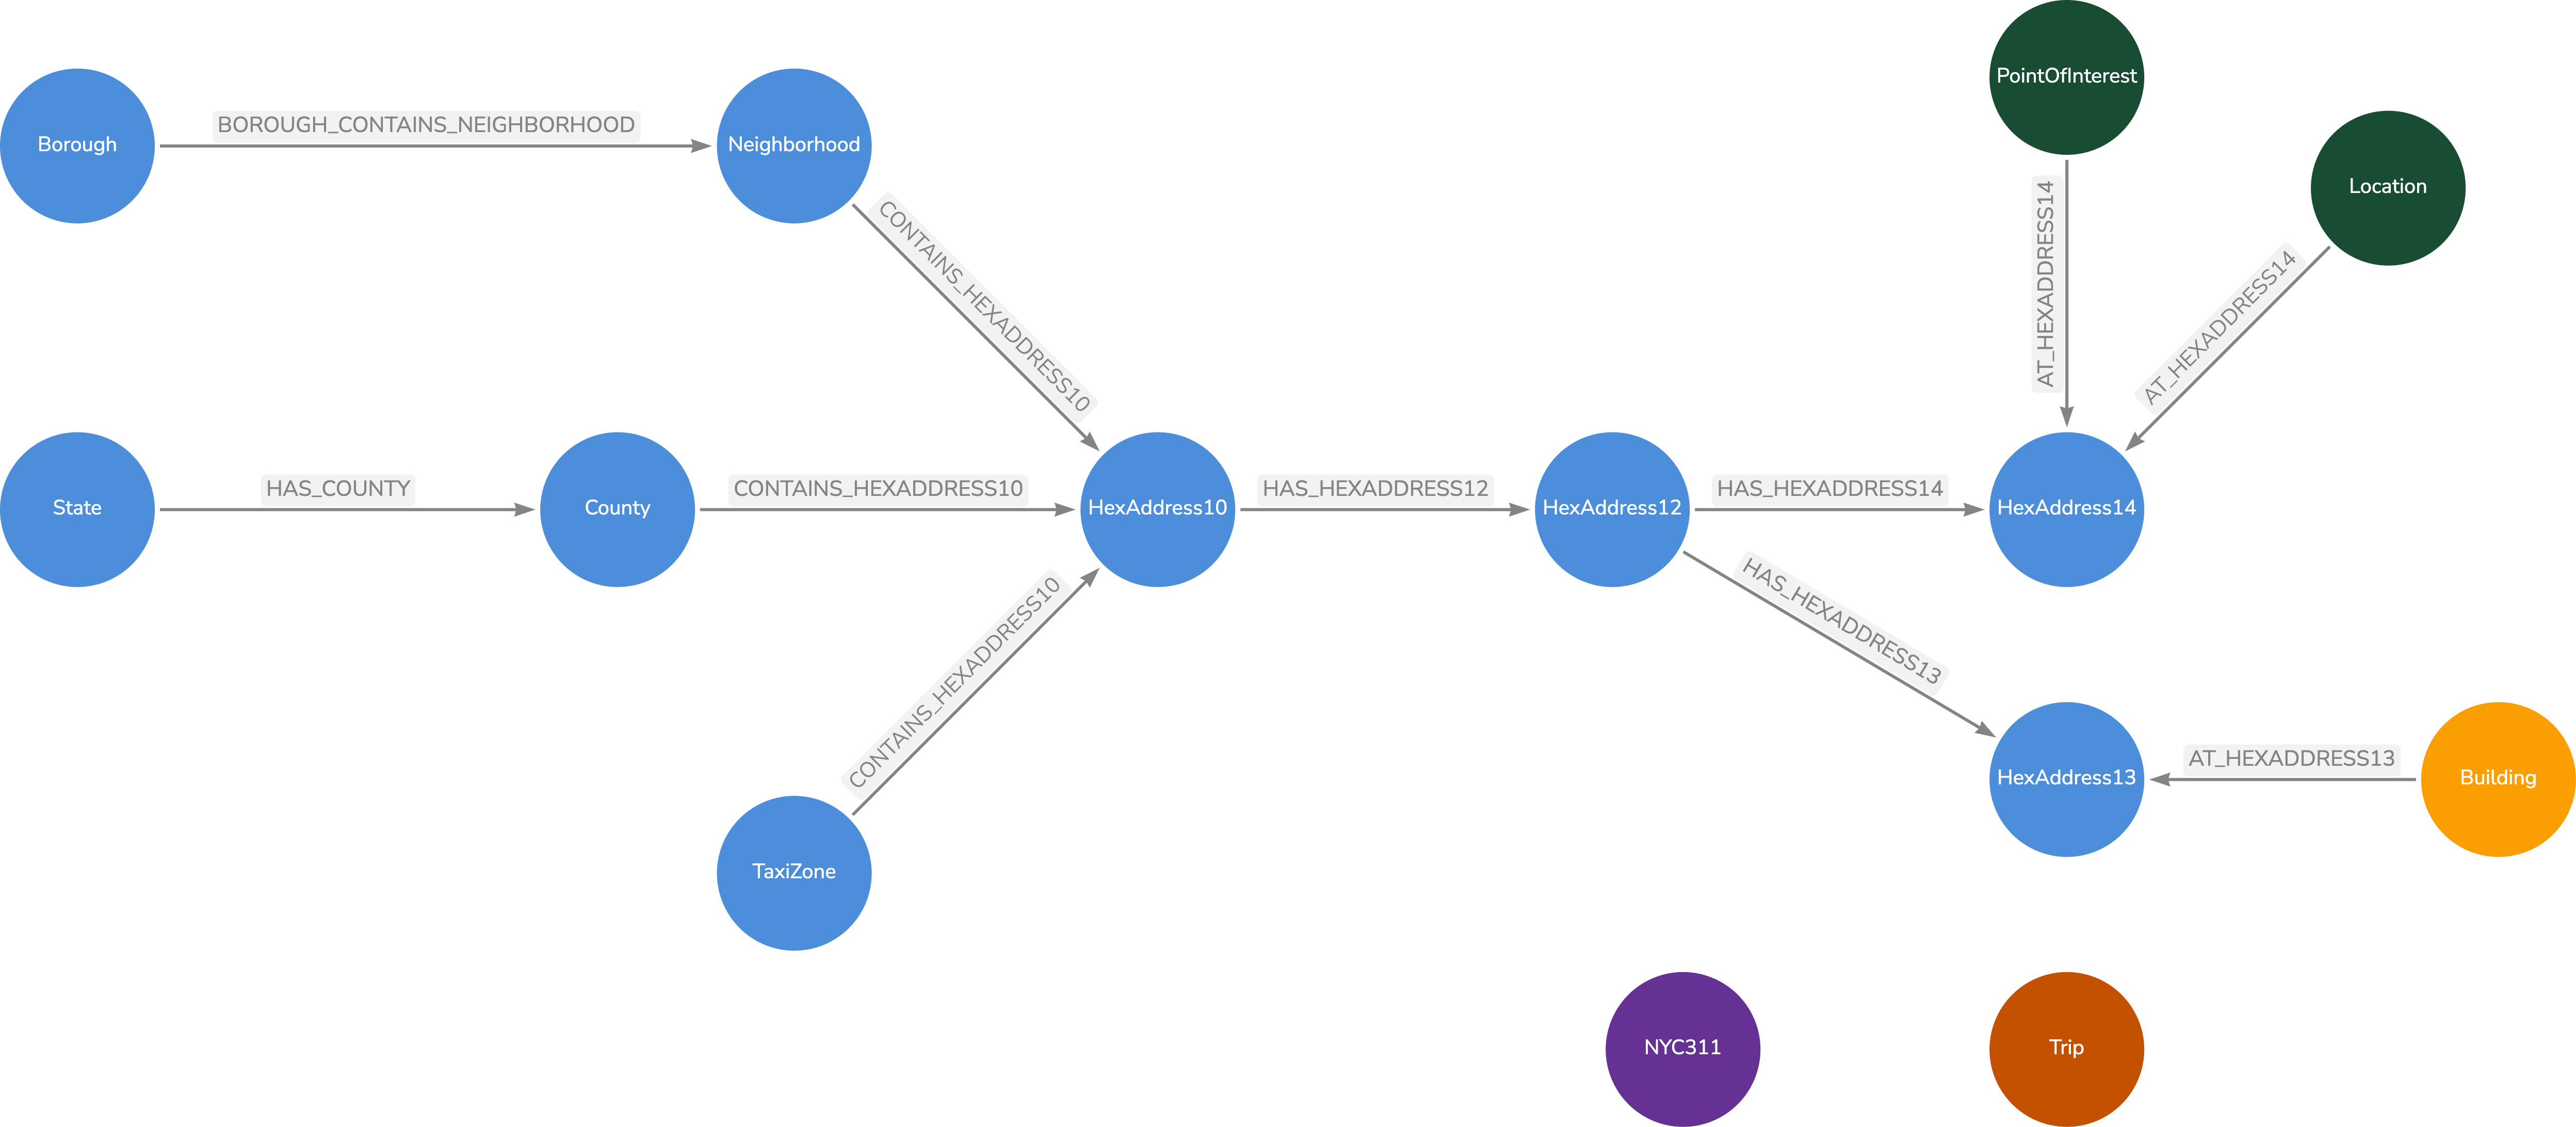
In the model, I calculated the HexAddress at resolution 10 for the Neighborhood, County (NY State only) and the TaxiZones. For each HexAddress at resolution 10, we found the corresponding HexAddress12 values. For each HexAddress12, we found the corresponding HexAddress14 values. Points of Interest latitude/longitude were converted to a HexAddress14 value and linked to the appropriate HexAddress14 node.
Trips, NYC311 are by themselves for now. The trips have a HexAddress14 property for the dropoff and the pickoff latitude/longitudes. We will index those properties and just look up the values to identify the trips within a neighborhood, taxi zone or county.
If you have sparse points of interest or some sparse data, an approach to minimize the number of HexAddress nodes would be to index the nodes at the smallest resolution (i.e. 14). For each of those resolutions, find their parent at resolution 12 and create a node/relationship. Find the parent at resolution 10 for each resolution 12 node. This way there are only the hex addresses that would actually be connected to data.
For example, in my home state of South Dakota, there may not be a lot of Points of Interest. I would not want to create hex addresses for counties where there are no Points of Interest associated with them.
Thanks for reading this far. Next time we will talk a little more in depth about building the geospatial knowledge graph.