What Is a Knowledge Graph?
Here is the definition from the Neo4j white paper “A knowledge graph is an interconnected dataset enriched with semantics so we can reason about the underlying data and use it confidently for complex decision-making”.
Connecting data adds context and improves outcomes. Connecting data makes that data inherently more valuable and provides dynamic context. Knowledge graphs provide deep, dynamic context. They enable people to find all related information in one place, with all of the relationships across that data.
We are going to create a database of publicly available geospatial data and create a graph that we can use as a reference point. The geospatial reference data consists of Taxi Zones, Counties, Neighborhoods and Buildings. These items rarely update or move so we are going to create our knowledge graph from that data. We will then add in other data sets (NPI data, NYC 311 calls and NYC Taxi pickups) into other databases. Using the H3 hex addresses, we can easily join across the data sets where the geospatial knowledge graph is our source of reference locations.
H3 Addressing and Resolutions
H3 is a geospatial indexing system that partitions the world into hexagonal cells. With H3, we can assign or relate a geographic location to a series of H3 addresses. Once we have the H3 address, we can locate other things (building, road, store) within or near the H3 address or we can identify events that happened nearby. H3 allows us to easily deal with large volumes of data.
H3 is a hierarchical grid system. As such, it has
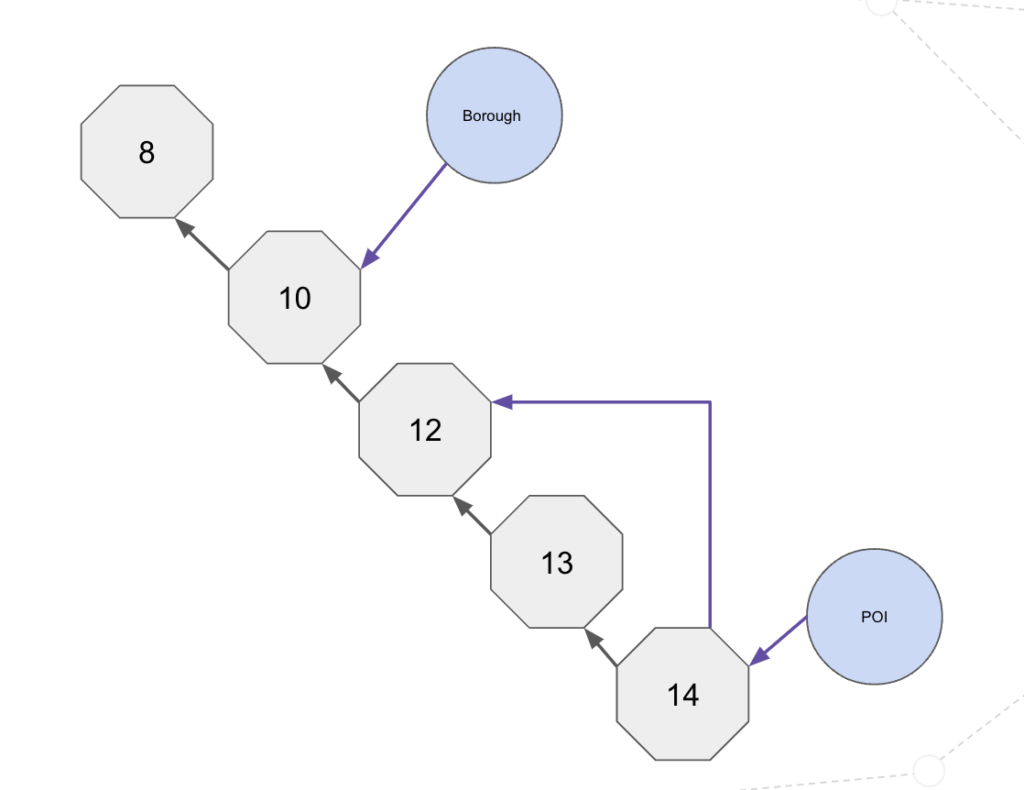
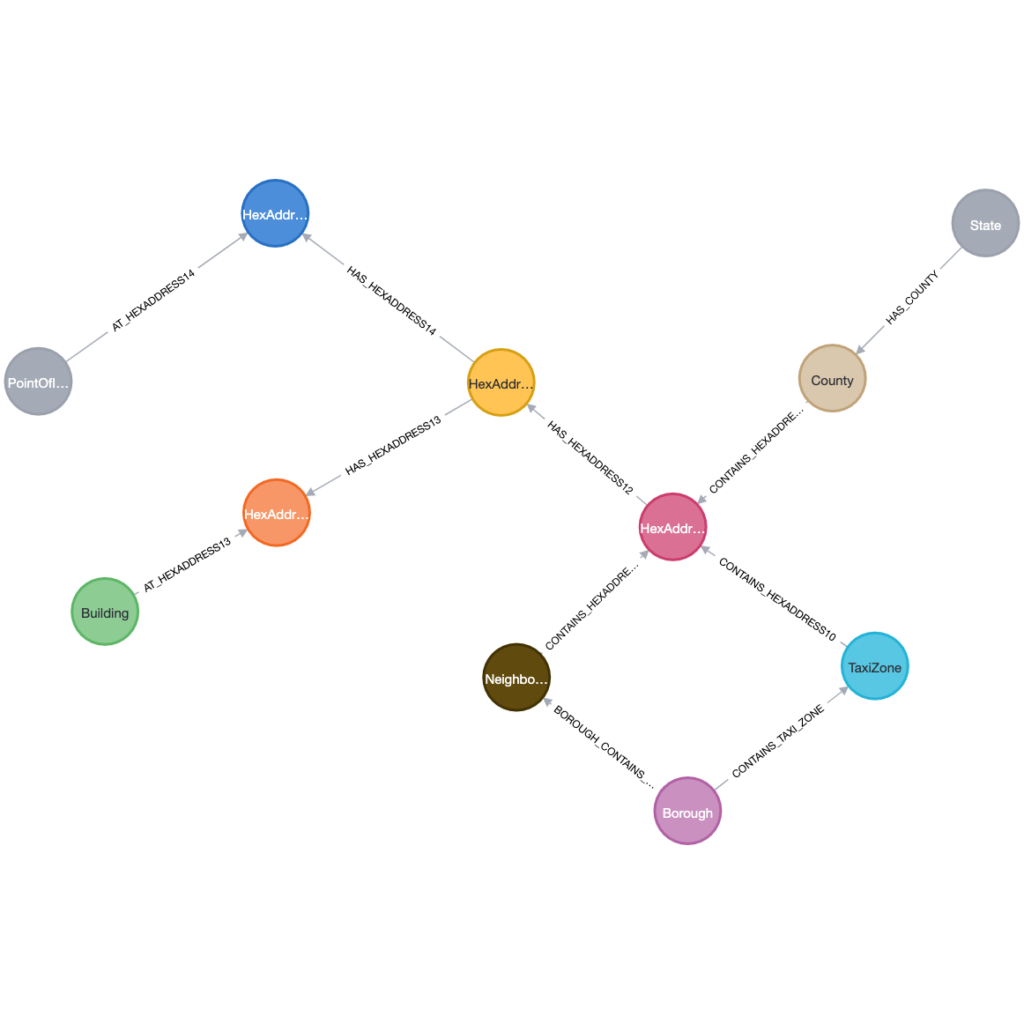
With the hierarchical layout, we can link the different hex address based on their parent cell. Once we do that, we could easily go from a Neighborhood node to a POI node or go from a POI node up to the Borough. This looks like the following: A question that we should answer is “do I need to create a node for every possible hex address?”. If we did create a node and the necessary relationships for every possible hex address, we would have millions to billions of nodes and relationships. Most of those would not be used and would take up space in the database. Instead, we are going to find the Resolution 14 nodes in our geospatial graph and connect them to their Resolution 13 parent. For each of the Resolution 13 nodes, we connect them to their Resolution 12 parent. We sill go from Resolution 12 to Resolution 10 and from Resolution 10 to Resolution 8. Our Neo4j Geospatial Graph data model looks like the following: We’ve discussed why we would want to build a geospatial graph database and how we would go about it with the H3 Hexagonal hierarchical geospatial indexing system. We talked about approaches dealing with the H3 resolutions as well. Now that we have our logical model, the next post will be a short overview of loading the data.Hierarchical Layout
Should we create a node for every hex address?
We can use the H3 toParent function and the H3 toChildren function to get the parent node at a desired resolution or all children nodes at a desired resolution. For example, we can find a Neighborhood, collect all resolution 10 addresses, find their children at resolution 14 and use that set of values to find all of the NYC 311 calls in that neighborhood.Our Neo4j Model
Wrap-Up