Recently, some of the prospects that I work with have wanted to understand event data and felt like a graph database would be the best approach. Being new to graphs, they aren’t always sure of the best modeling approach.
There are some resources available that talk about modeling events. For example, Neo4j’s own Mark Needham published a blog post showing modeling TV shows among other events.. Snowplow published a recent blog post that describes a similar data model.
One thing that we always try to stress is to build the model to effectively answer the questions you ask of the graph. In this prospect’s case, they were collecting item scans that occurred within a warehouse. Each item had a series of scans as it moved through the warehouse. Based on the individual item or even a type of item, could they discover common patterns or deviations from the normal pattern? Another use case for this would be to track how users traverse a website or how students complete an on-line course.
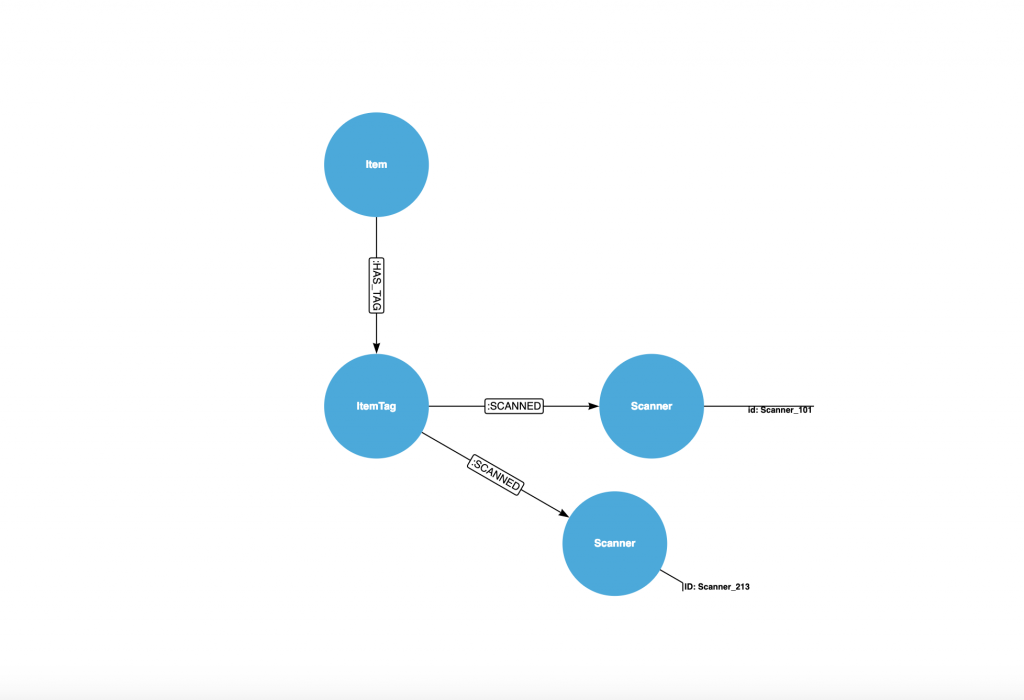
An initial approach might be to create a relationship between each item and the scanner. The model is shown below:

An (:Item)-[:HAS_TAG]->(:ItemTag)-[:SCANNED]->(:Scanner) is the Cypher pattern for this model.
In this model, it is easy to understand how many times an :ItemTag was scanned. Over time, a Scanner could easily become a supernode where we have millions of :SCANNED relationships attached to the node. Furthermore, if we want to find common patterns, we have to look at all :SCANNED relationships, order them by a property and then do comparisons. The amount of work increases as the amount of :SCANNED relationships increase. This is similar to the AIRPORT example in Max’s blogpost.
So what can we do? Let’s change the model to be a series of SCAN events that form a series of events from the initial scan to the final scan. For the relationship types, instead of using :NEXT or :PREVIOUS, we will name the relationship types by the scanner id. Let’s look at that model:

In this model, an :Item has an :ItemDay. This allows us to manage and search all tags by item and by day without creating supernodes. Between each :SCAN node, we use a specific relationship type that indicates the scanner. This allows us to easily find patterns within the data. Neo4j allows for over 64k custom relationship types, so you should be good with this approach.
If you were modeling a TV show, you may want to track when a NEW episode was show versus a REPEAT episode. You could model that as:
(:Episode)-[:NEW]->(:Episode)-[:REPEAT]->(:Episode)-[:REPEAT]->(:Episode)
For an item, we can find the most common patterns using the below Cypher code:
match (r:Tag)
with r
match path=(r)-[re*..50]->(:Scan)
with r.TagID as TagID,  [r IN re | TYPE(r)] as paths
order by length(path) desc
with collect(paths) as allPaths, TagID
return count(TagID) as tagCount, head(allPaths)
order by tagCount desc;
The use of the variable length relationship allows us to easily find those patterns no matter the length. If we want to find an anomaly such as where :SCANNER_101 wasn’t the first scan, we could do something like:
match path=(a1:Tag)-[r2]->(a:Scan)-[r1:SCANNER_101]->(b:Scan)
return count(path);
With the ability to add native date/time properties to a node, we can use Cypher to calculate durations between event scans. For example, this snippet shows the minimum, maximum and average duration between scans for each type of scan.
match (a:Scan)-[r1]->(b:Scan)
with r1, duration.between(a.scanDateTime,b.scanDateTime) as theduration
return type(r1), max(theduration.minutes), min(theduration.minutes), avg(theduration.minutes)
order by type(r1) asc, avg(theduration.minutes) desc;
When modeling data in Neo4j, think of how you want to traverse the graph to get the answers that you need. The answers will inevitably determine the shape of the graph and the model that you choose.
Excellent