Earlier this year, Sunlight foundation filed a lawsuit under the Freedom of Information Act. The lawsuit requested solication and award notices from FBO.gov. In November, Sunlight received over a decade’s worth of information and posted the information on-line for public downloading. I want to say a big thanks to Ginger McCall and Kaitlin Devine for the work that went into making this data available.
In the first part of this series, I looked at the data and munged the data into a workable set. Once I had the data in a workable set, I created some heatmap charts of the data looking at agencies and who they awarded contracts to. In part two of this series, I created some bubble charts looking at awards by Agency and also the most popular Awardees. In the third part of the series, I looked at awards by date and then displaying that information in a calendar view. Then we will look at the types of awards as well as some bi-grams in the descriptions of the awards.
Those efforts were time consuming and took a lot of manual work to create the visualizations. Maybe there is a simpler and easier way to look at the data. For this post, I wanted to see if Elasticsearch and their updated dashboard (Kibana) could help out.
MortarData to Elasticsearch
Around October of last year, Elasticsearch announced integration with Hadoop. “Using Elasticsearch in Hadoop has never been easier. Thanks to the deep API integration, interacting with Elasticsearch is similar to that of HDFS resources. And since Hadoop is more then just vanilla Map/Reduce, in elasticsearch-hadoop one will find support for Apache Hive, Apache Pig and Cascading in addition to plain Map/Reduce.”
Elasticsearch published the first milestone (1.3.0.M1) based on the new code-base that has been in the works for the last few months.
I decided to use MortarData to output the fields that I want to search, visualize and dynamically drill down. Back in October, Mortar was able to update their platform to allow Mortar to write out to Elasticsearch at scale. Using the Mortar platform, I wrote a pig script that was able to read in the FBO data and manipulate it as needed. I did neet to modify the output of the Posted Date and Contract Award Date to ensure I had a date/time format that looked like ‘2014-02-01T12:30:00-05:00’. I then wrote out the data directly to the Elasticsearch index. A sample of the code is shown below:
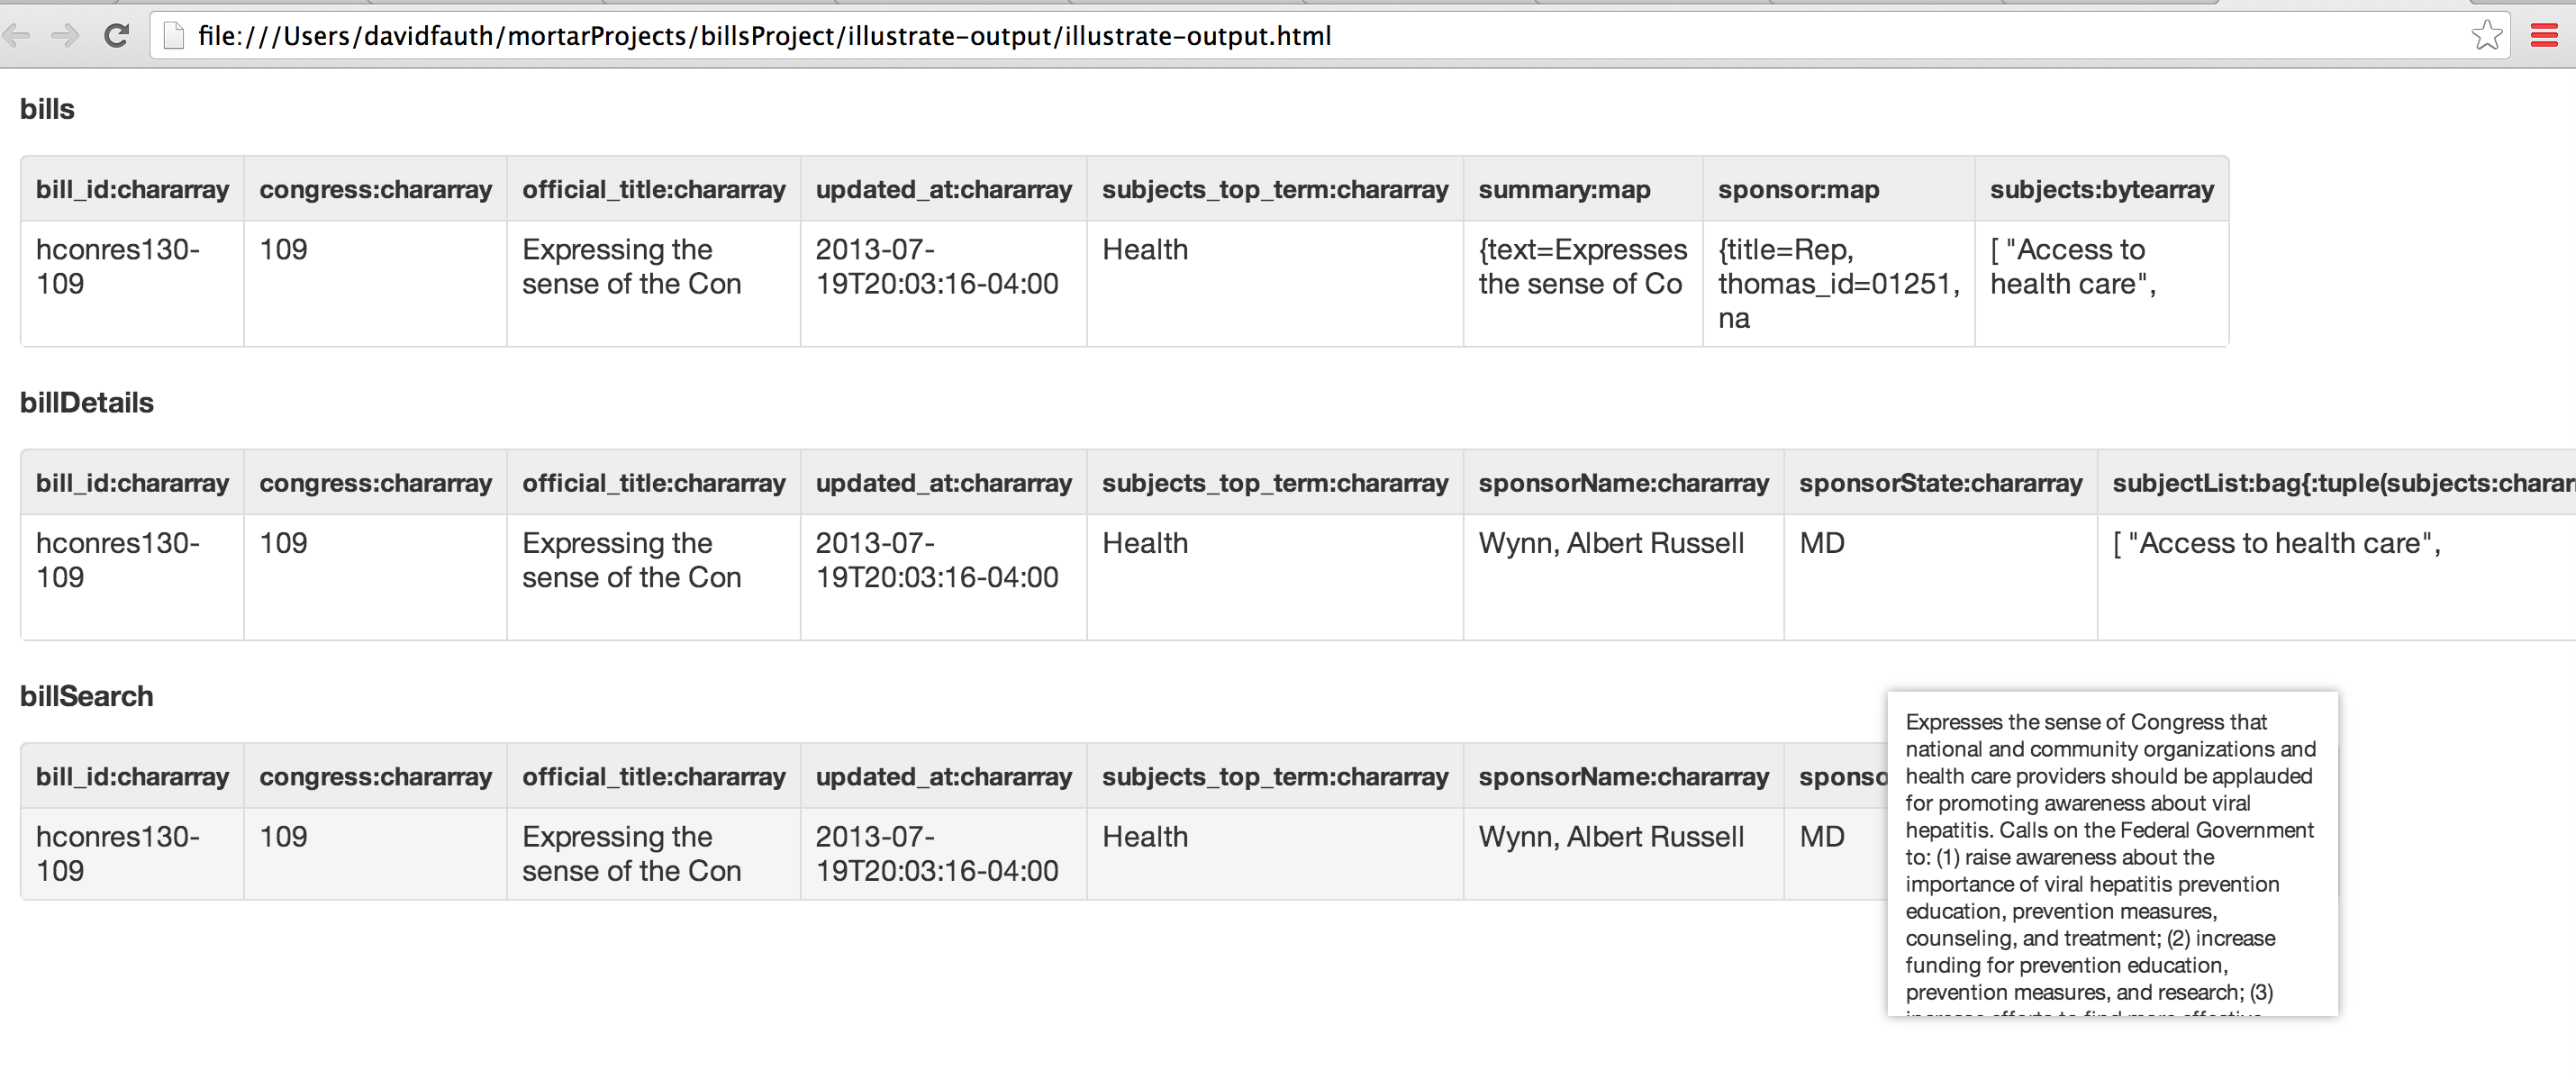
For GovTrack Bills data, it was a similar approach. I ensured the bill’s ‘Introduction Date’ was in the proper format and then wrote the data out to an Elasticsearch index. To ensure the output was correct, a quick illustration showed the proper dateformat.
After illustrating to verify the Pig script ran, I ran it on my laptop where it took about five minutes to process the FBO data. It took 54 seconds to process the GovTrack data.
Marvel
Elasticsearch just released Marvel. From the blog post,
“Marvel is a plugin for Elasticsearch that hooks into the heart of Elasticsearch clusters and immediately starts shipping statistics and change events. By default, these events are stored in the very same Elasticsearch cluster. However, you can send them to any other Elasticsearch cluster of your choice.
Once data is extracted and stored, the second aspect of Marvel kicks in – a set of dedicated dashboards built specifically to give both a clear overview of cluster status and to supply the tools needed to deep dive into the darkest corners of Elasticsearch.”
I had Marvel running while I loaded the GovTrack data. Let’s look at some screen captures to show the index being created, documents added, and then search request rate.
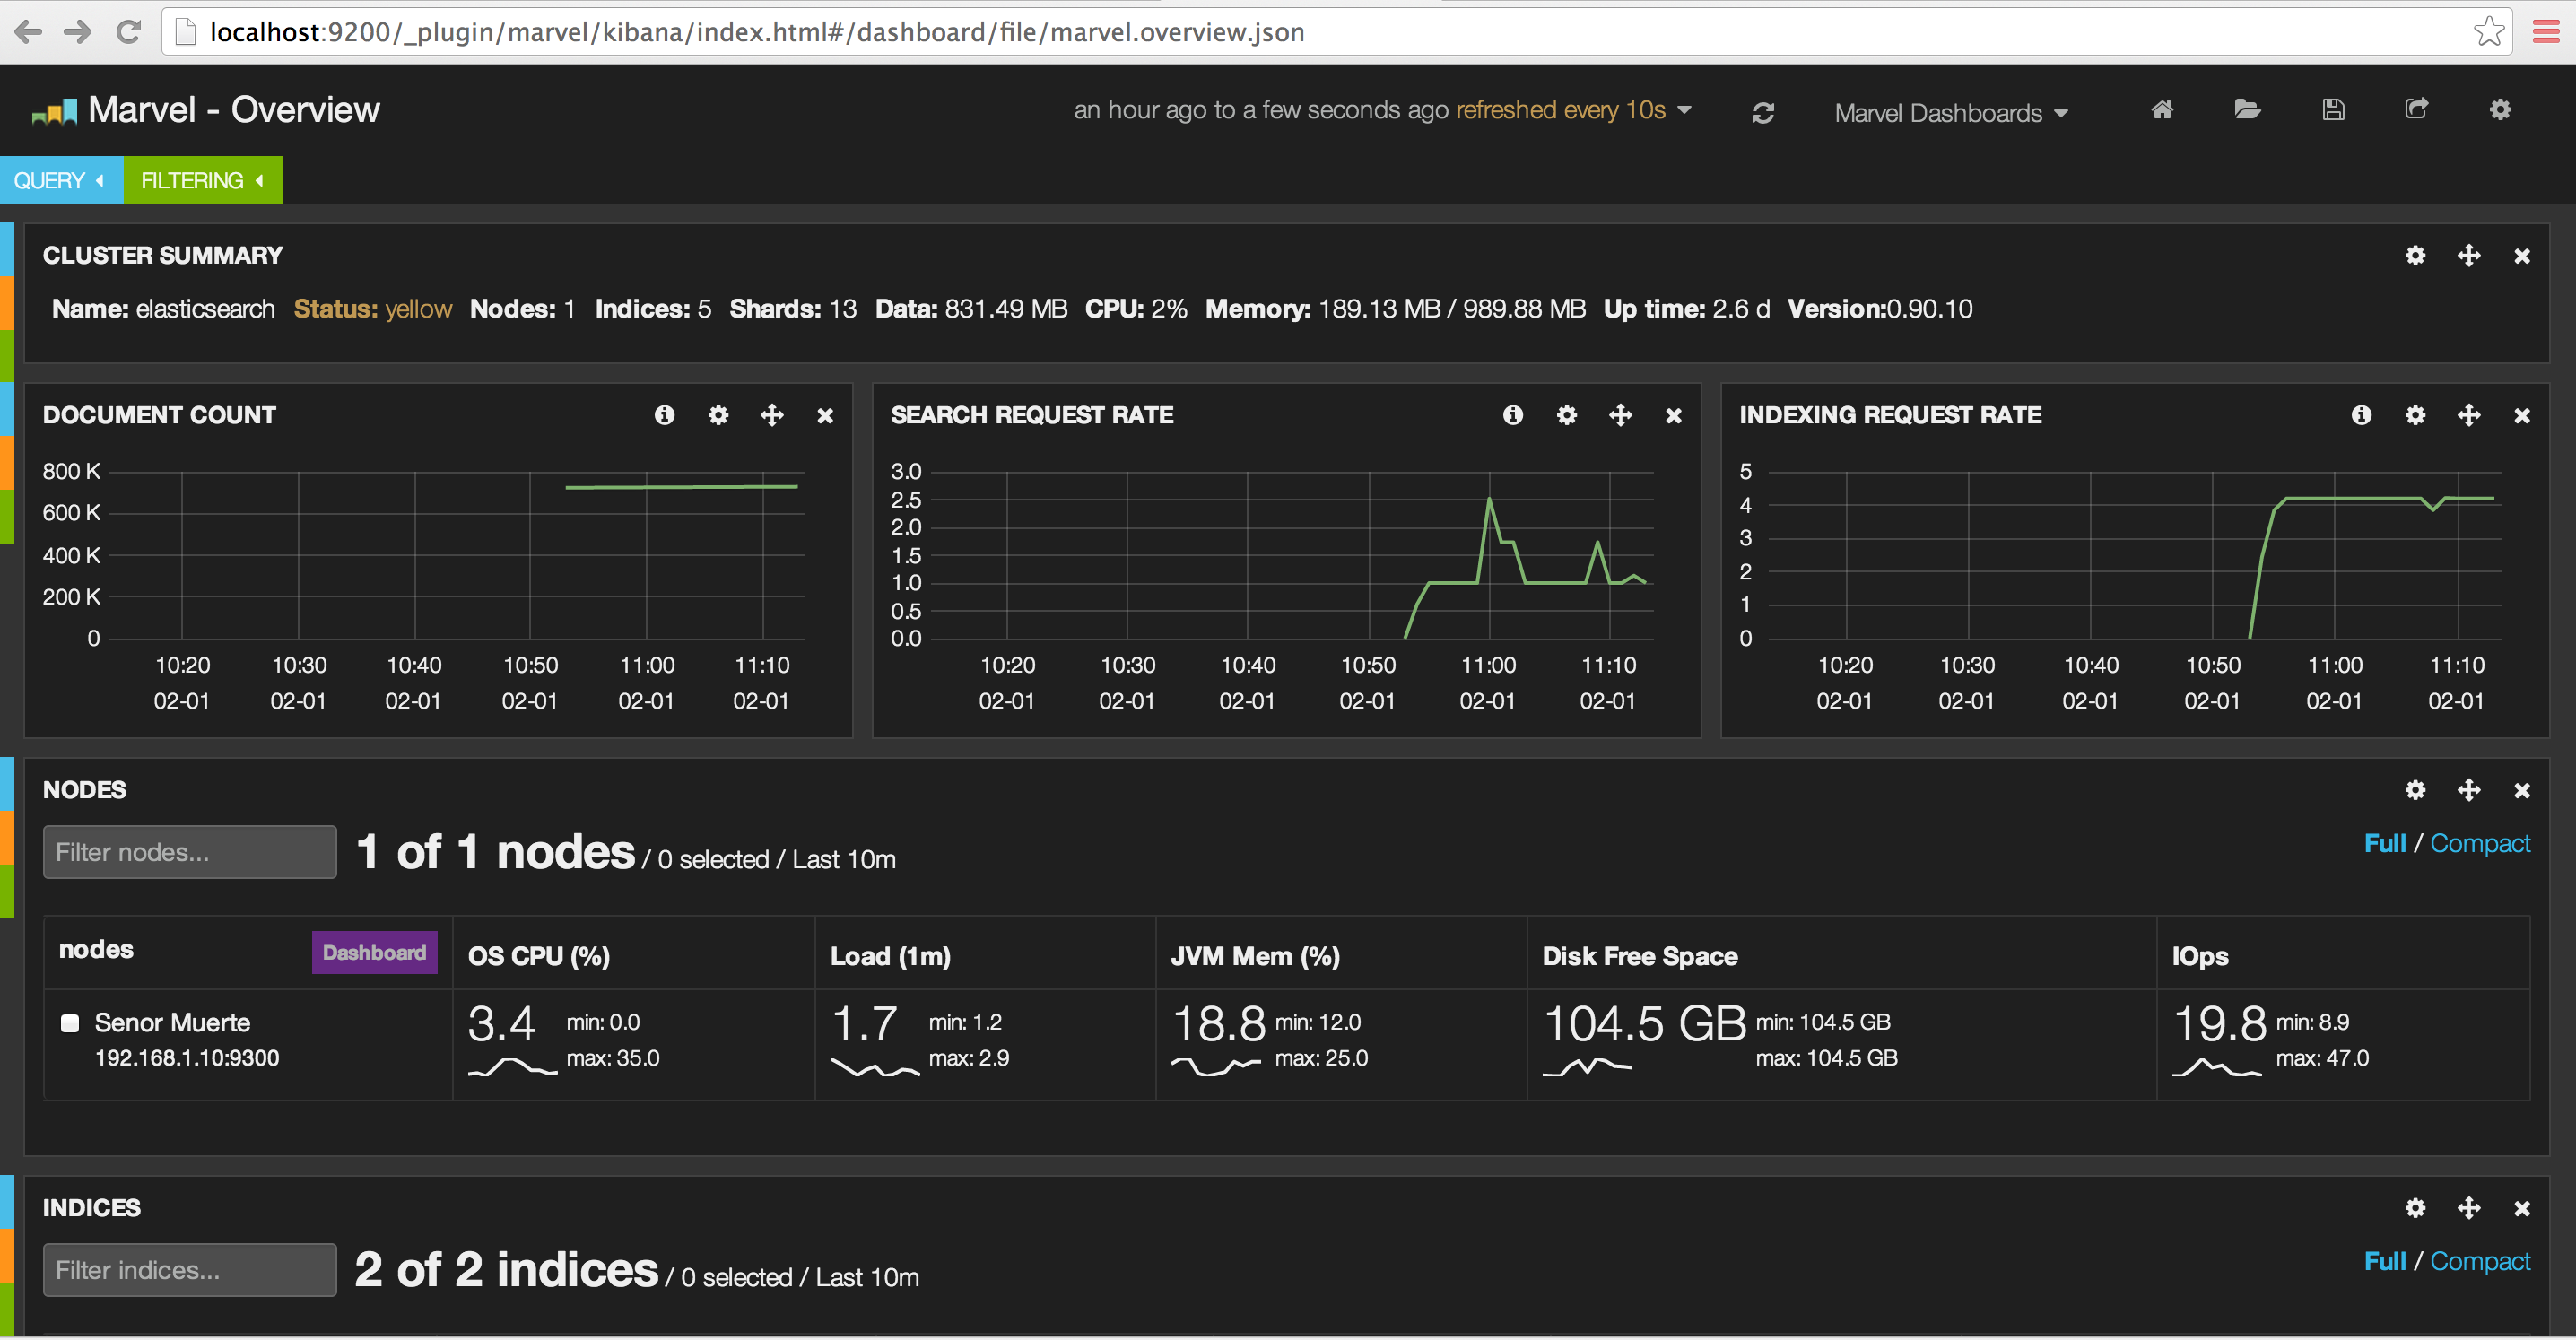
Before adding an index
This is a look at the Elasticsearch cluster before adding a new index. As you can see, we have two indexes created.
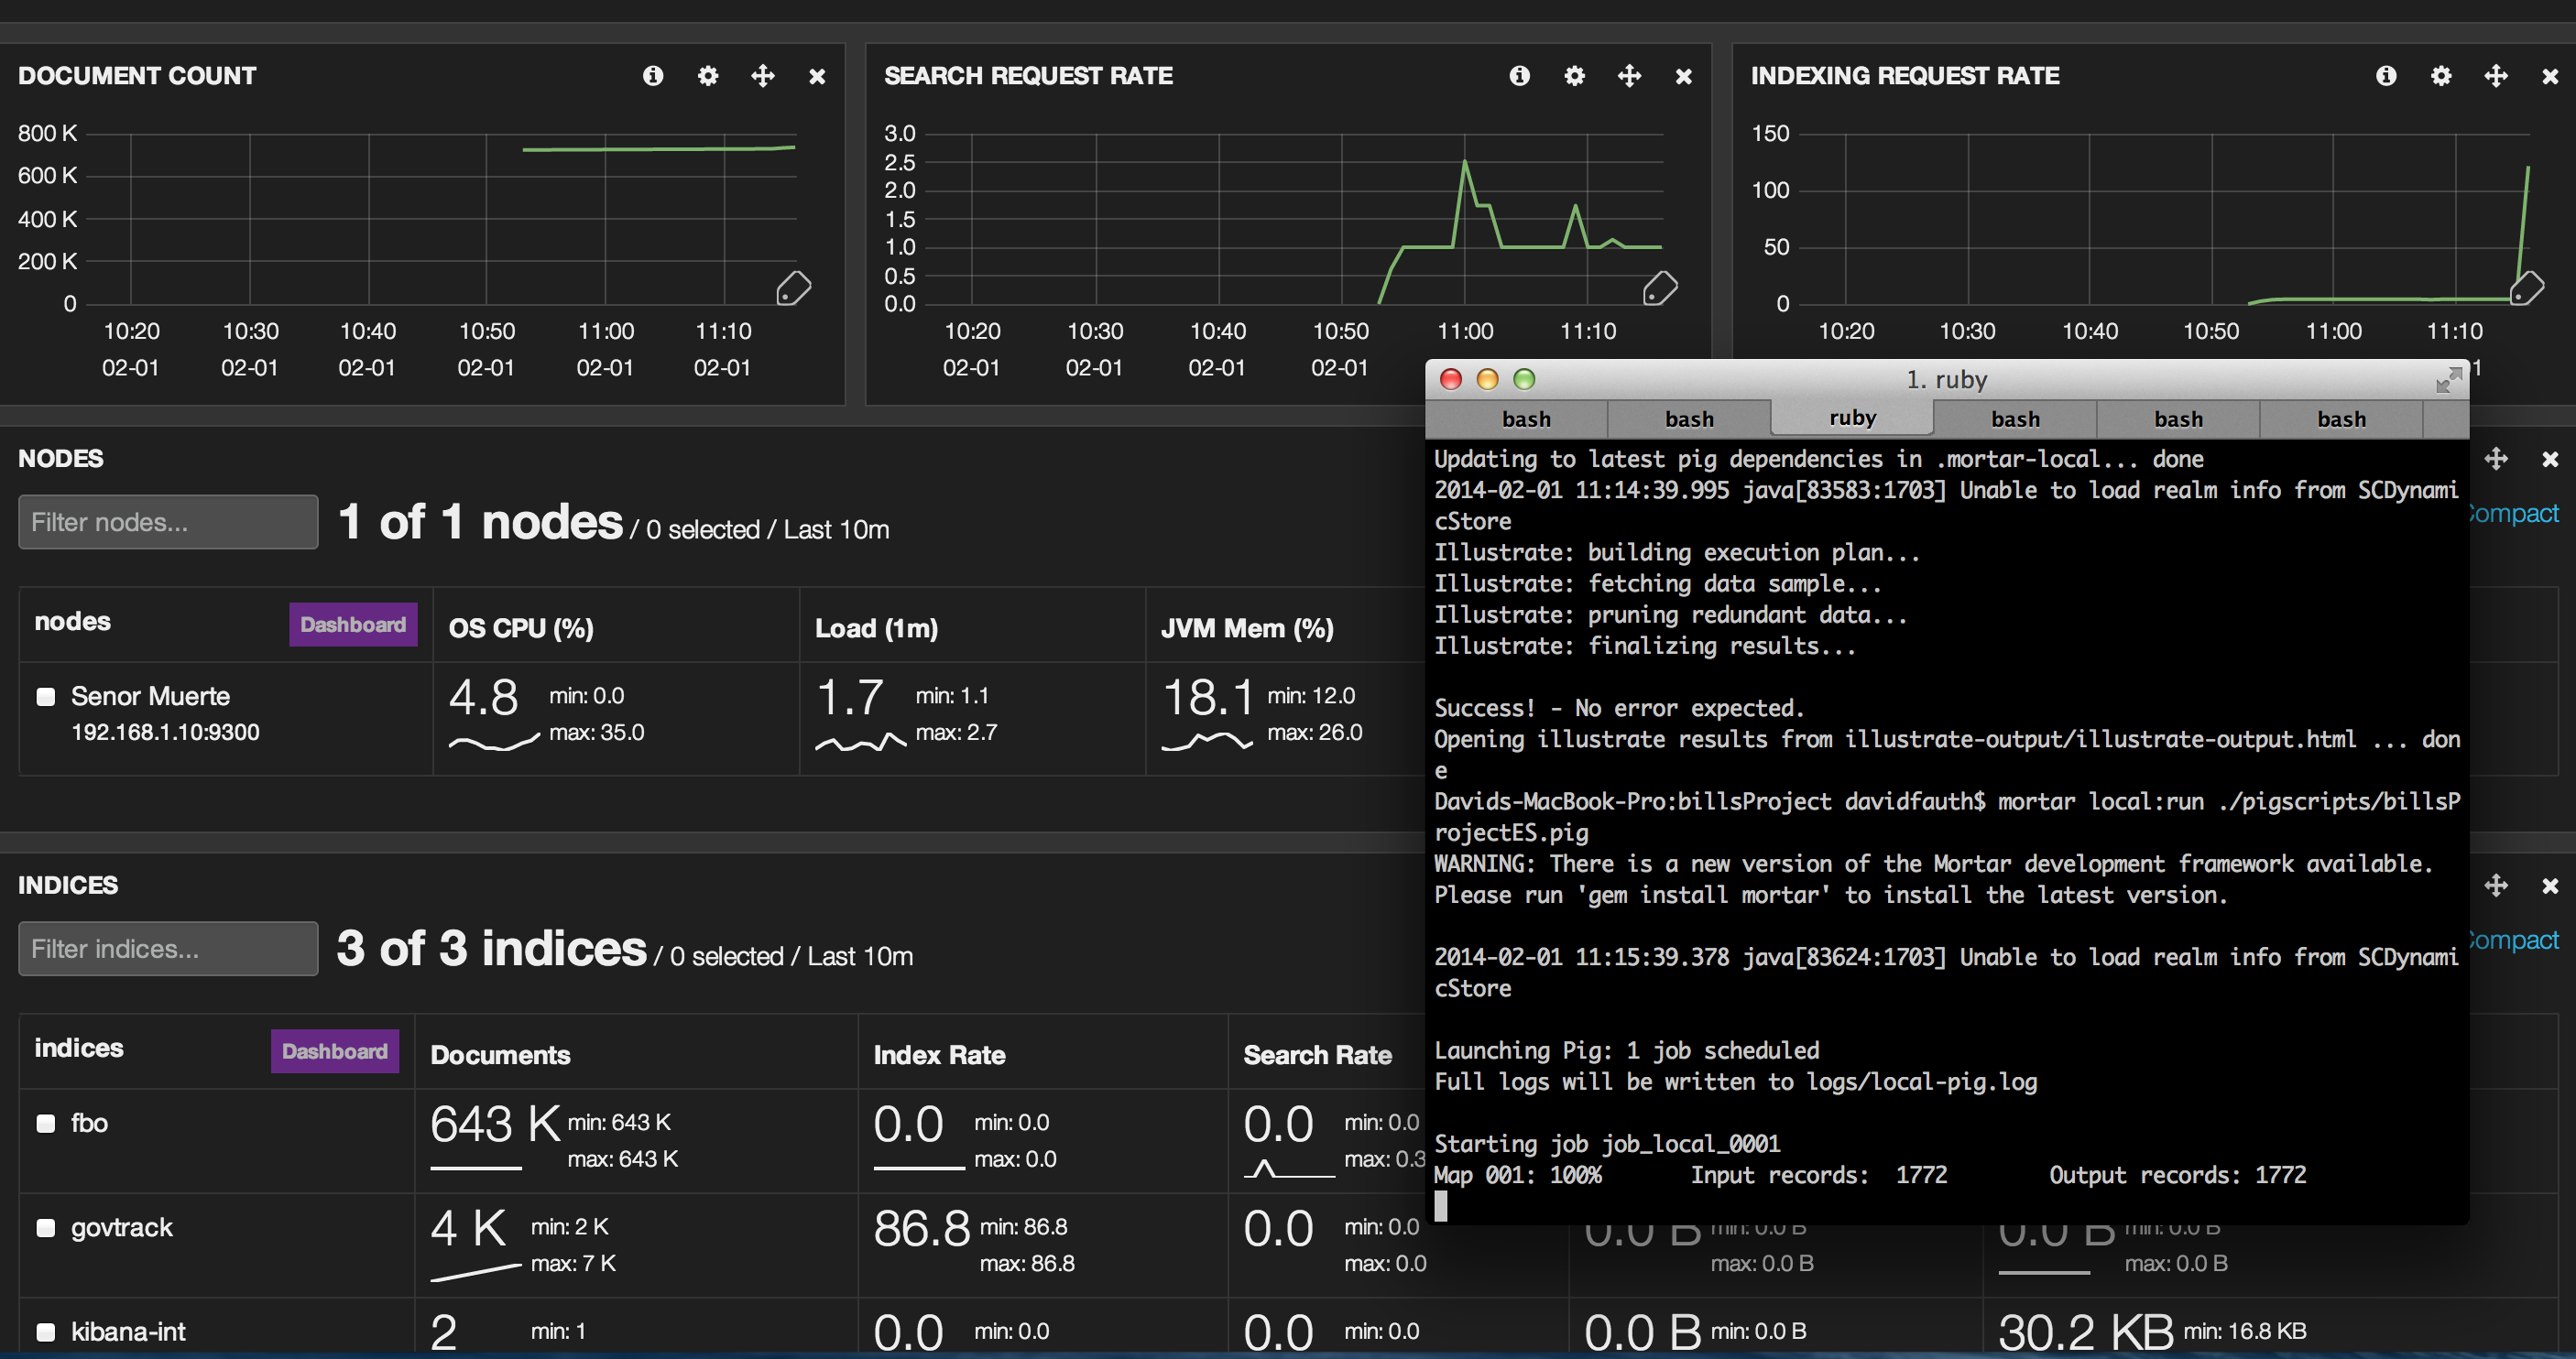
As the Pig job is running in Mortar, we see a third index (“govtrack”) created and you see the document count edge up and the indexing rate shoot up.
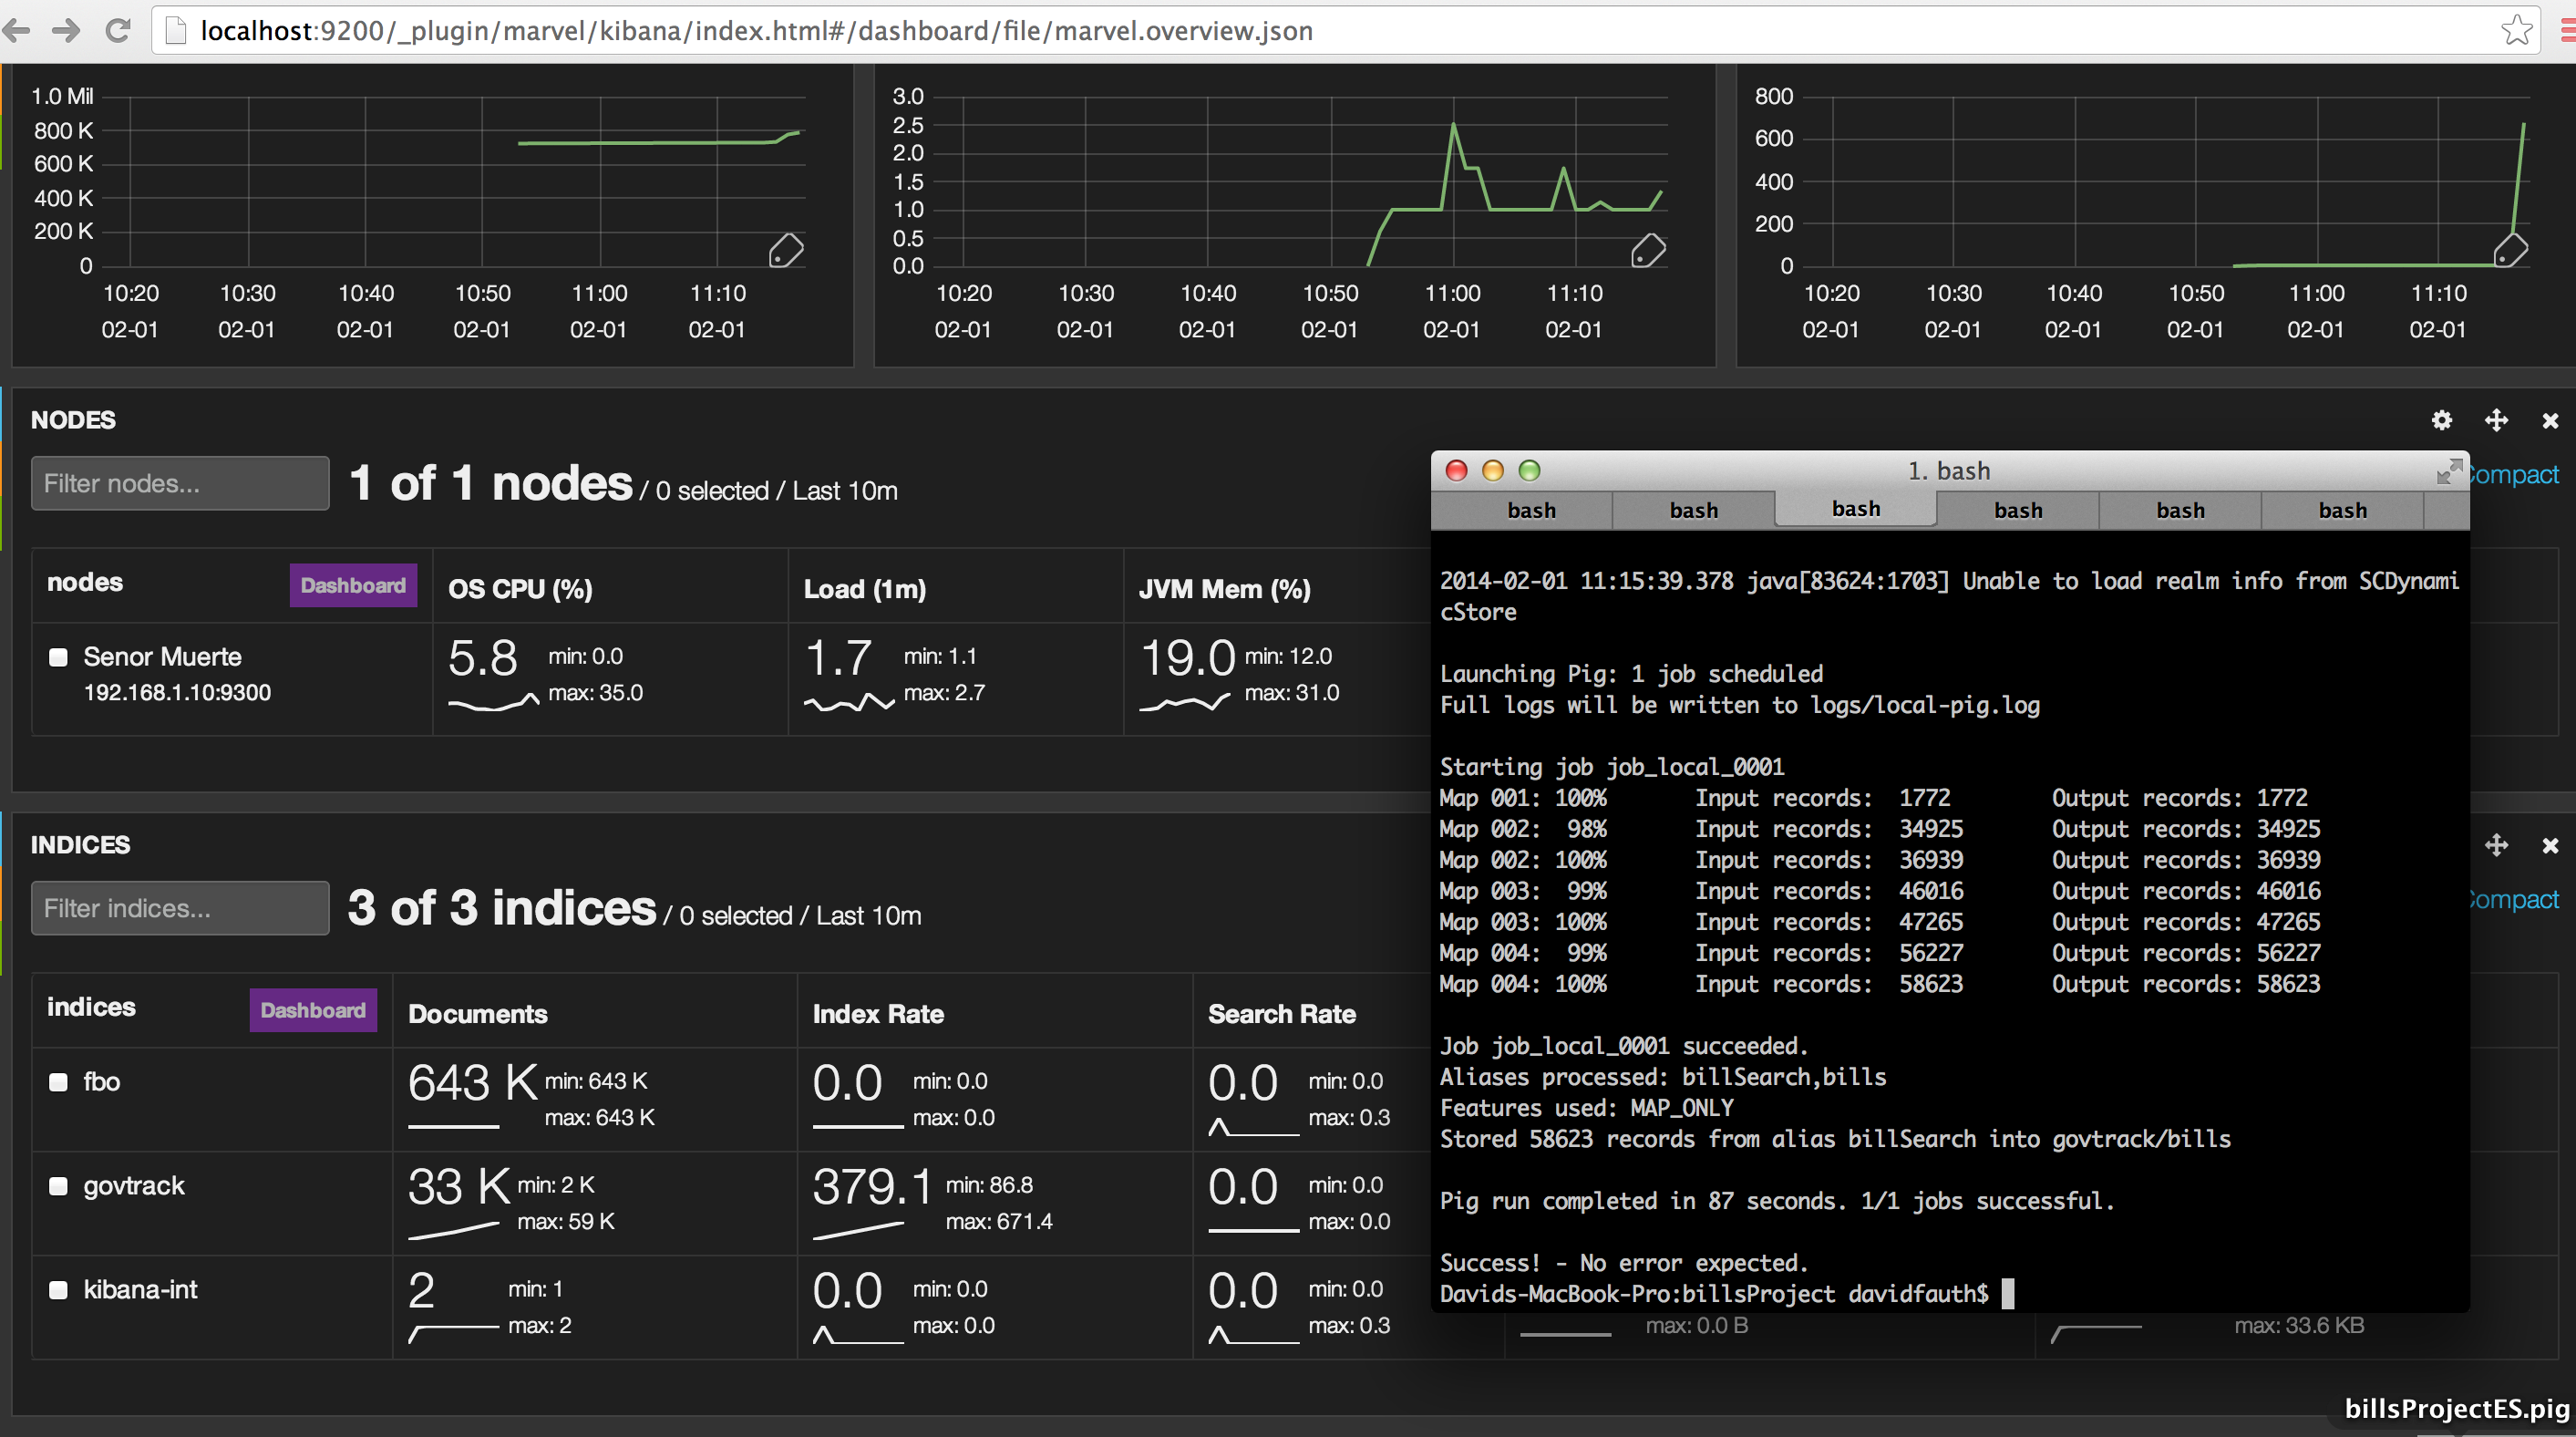
The pig job has finished and we see the uptick in documents indexed. We can also see the indexing rate as well.
This last screen shot shows some later work. I had to drop and recreate an index thus the small dip in documents and the indexing rates. You also see some searches that I ran using Kibana.
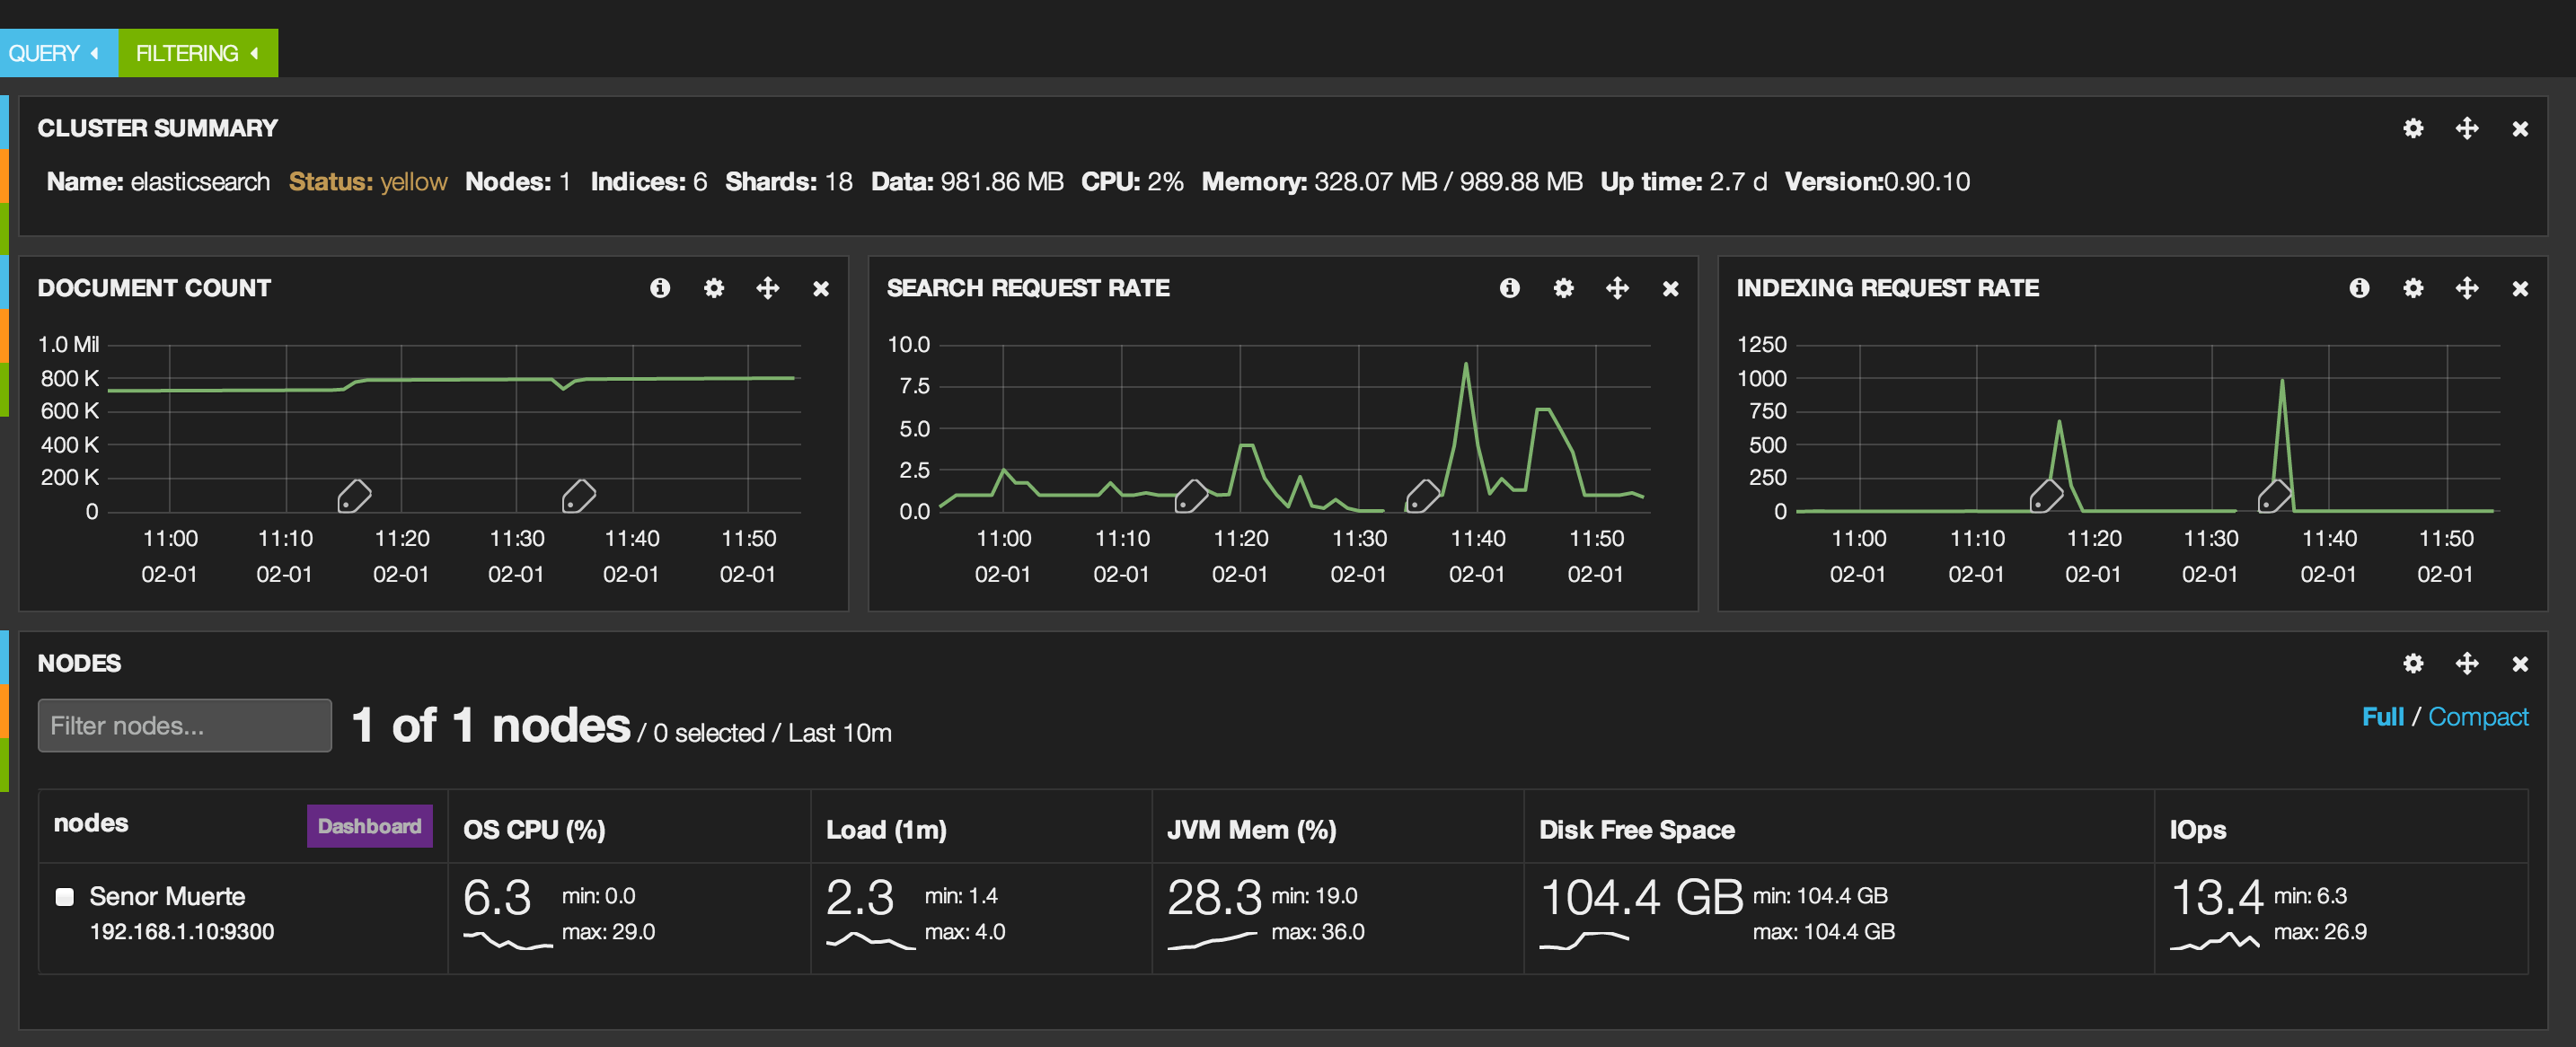
In summary, Marvel is a great tool to see what your cluster is doing through the dashboards.
Kibana
Elasticsearch works seamlessly with Kibana to let you see and interact with your data. Specifically, Kibana allows you to create ticker-like comparisons of queries across a time range and compare across days or a rolling view of average change. It also helps you make sense of your data by easily creating bar, line and scatter plots, or pie charts and maps.
Kibana sounded great for visualizing and interactively drilling down into the FBO data set. The installation and configuration is simple. It is a download, unzip, modify a single config.js file and open the URL (as long as you unzipped it so your webserver can load the URL).
Some of the advantages of Kibana are:
- You can get answers in real time. In my case, this isn’t as important as if you are doing log file analysis.
- You can visualize trends through bar, line and scatter plots. Kibana also provides pie charts and maps.
- You can easily create dashboards.
- The search syntax is simple.
- Finally, it runs in the browser so set-up is simple.
Kibana Dashboard for GovTrack Data
Using Kibana, I’m going create a sample dashboard to analyze the GovTrack bills data. You can read more about the dataset here. In a nutshell, I wanted to see if Kibana can let me drill down on the data and easily look at this data set.
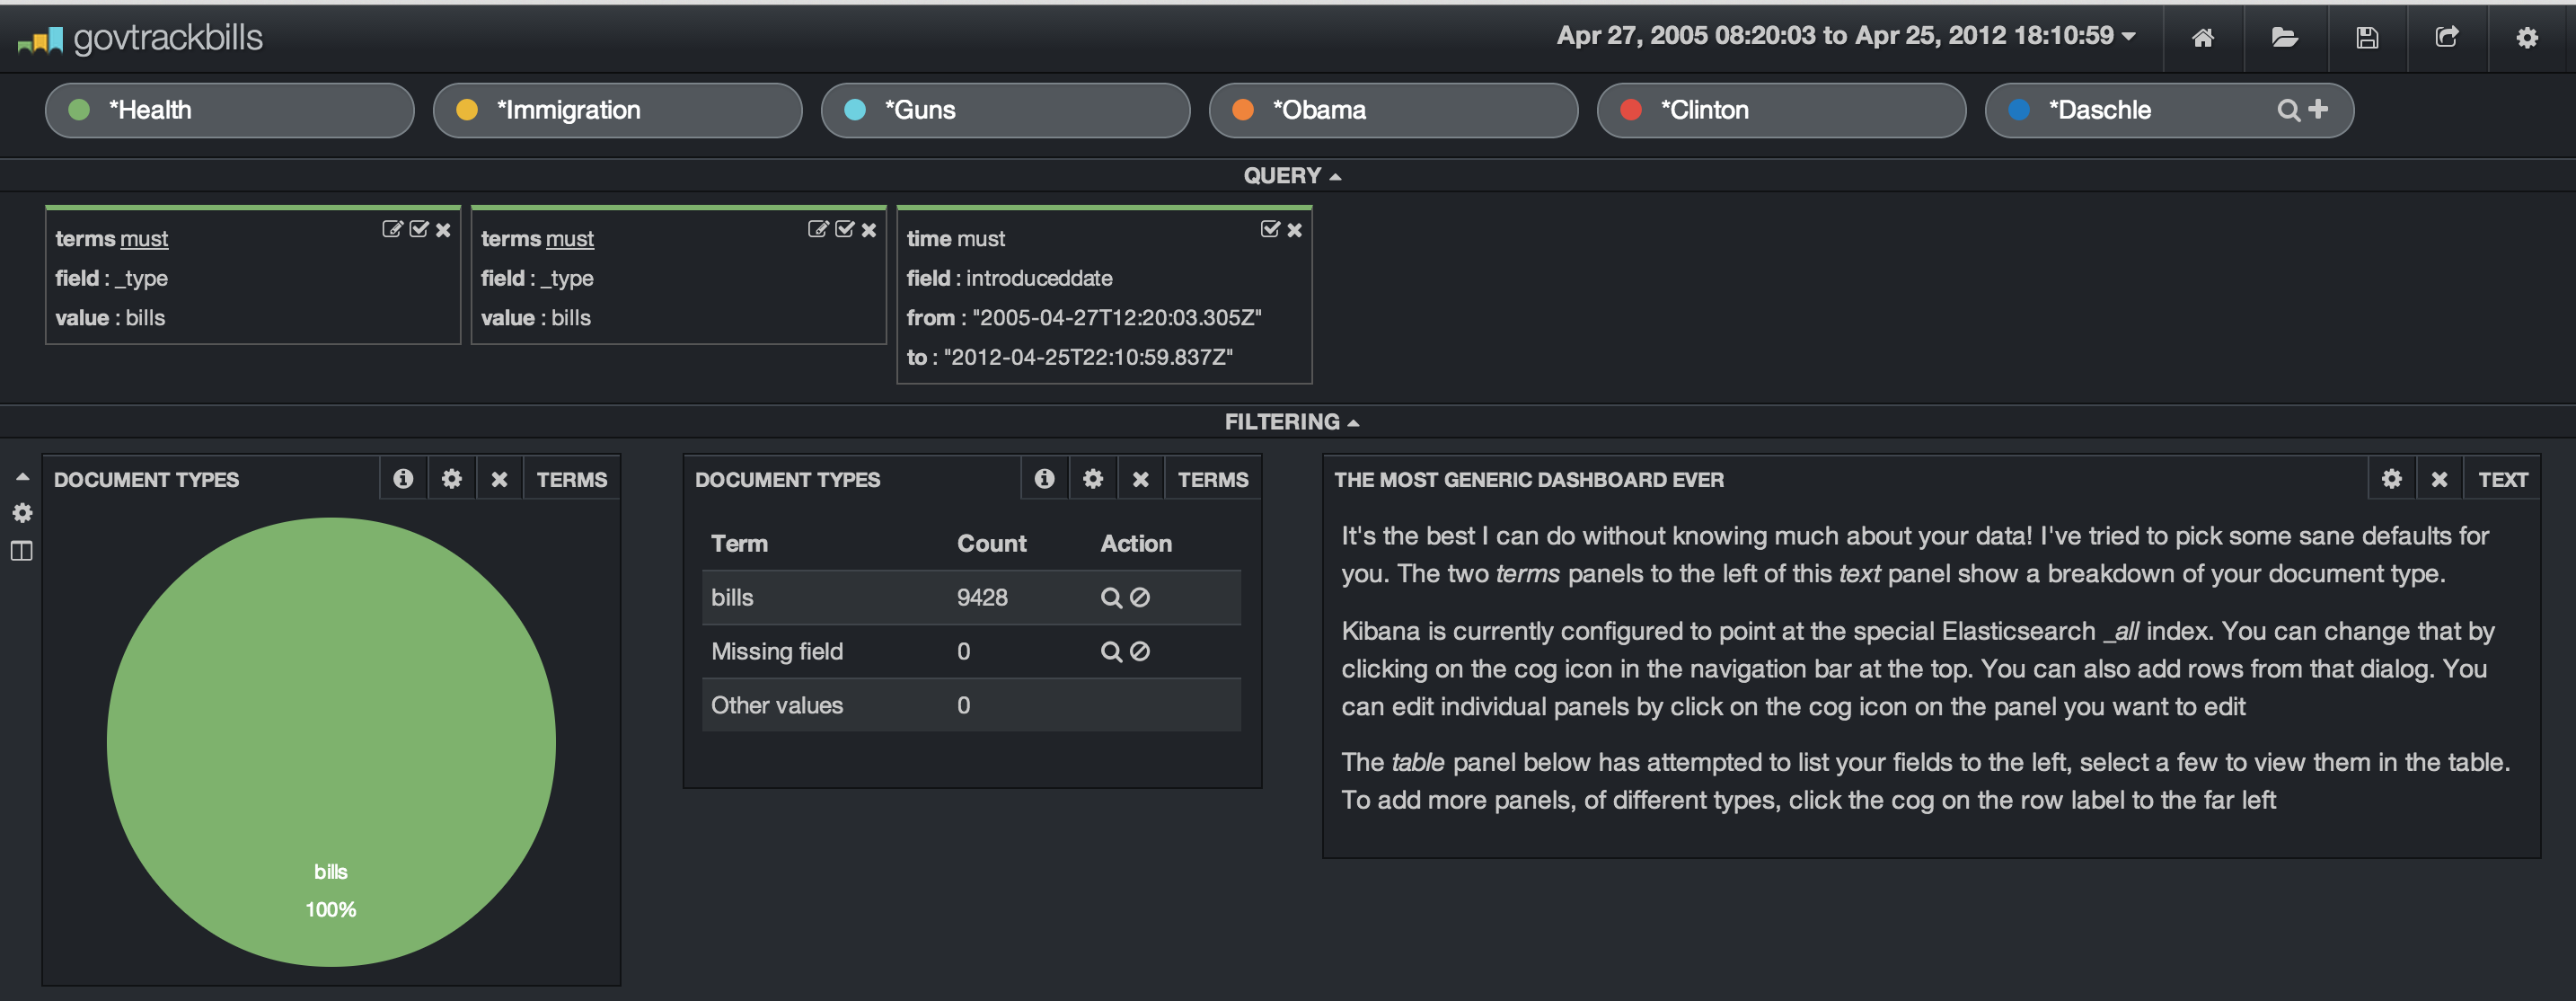
In my dashboard, I’ve set up multiple search terms. I’ve chosen some topics and sponsors of bills. We have Health, Immigration, Guns, Obama, Clinton and Daschle. I’ve added in some filters to limit the search index to the bills and set up a date range. The date range is from 2005 through 2012 even though I only have a couple of years worth of data indexed. We are shown a dataset of 9,428 bills.
Let’s look at an easy way to see when the term “Affordable Care Act” showed up in various bills. This is easily done by adding this as a filter.
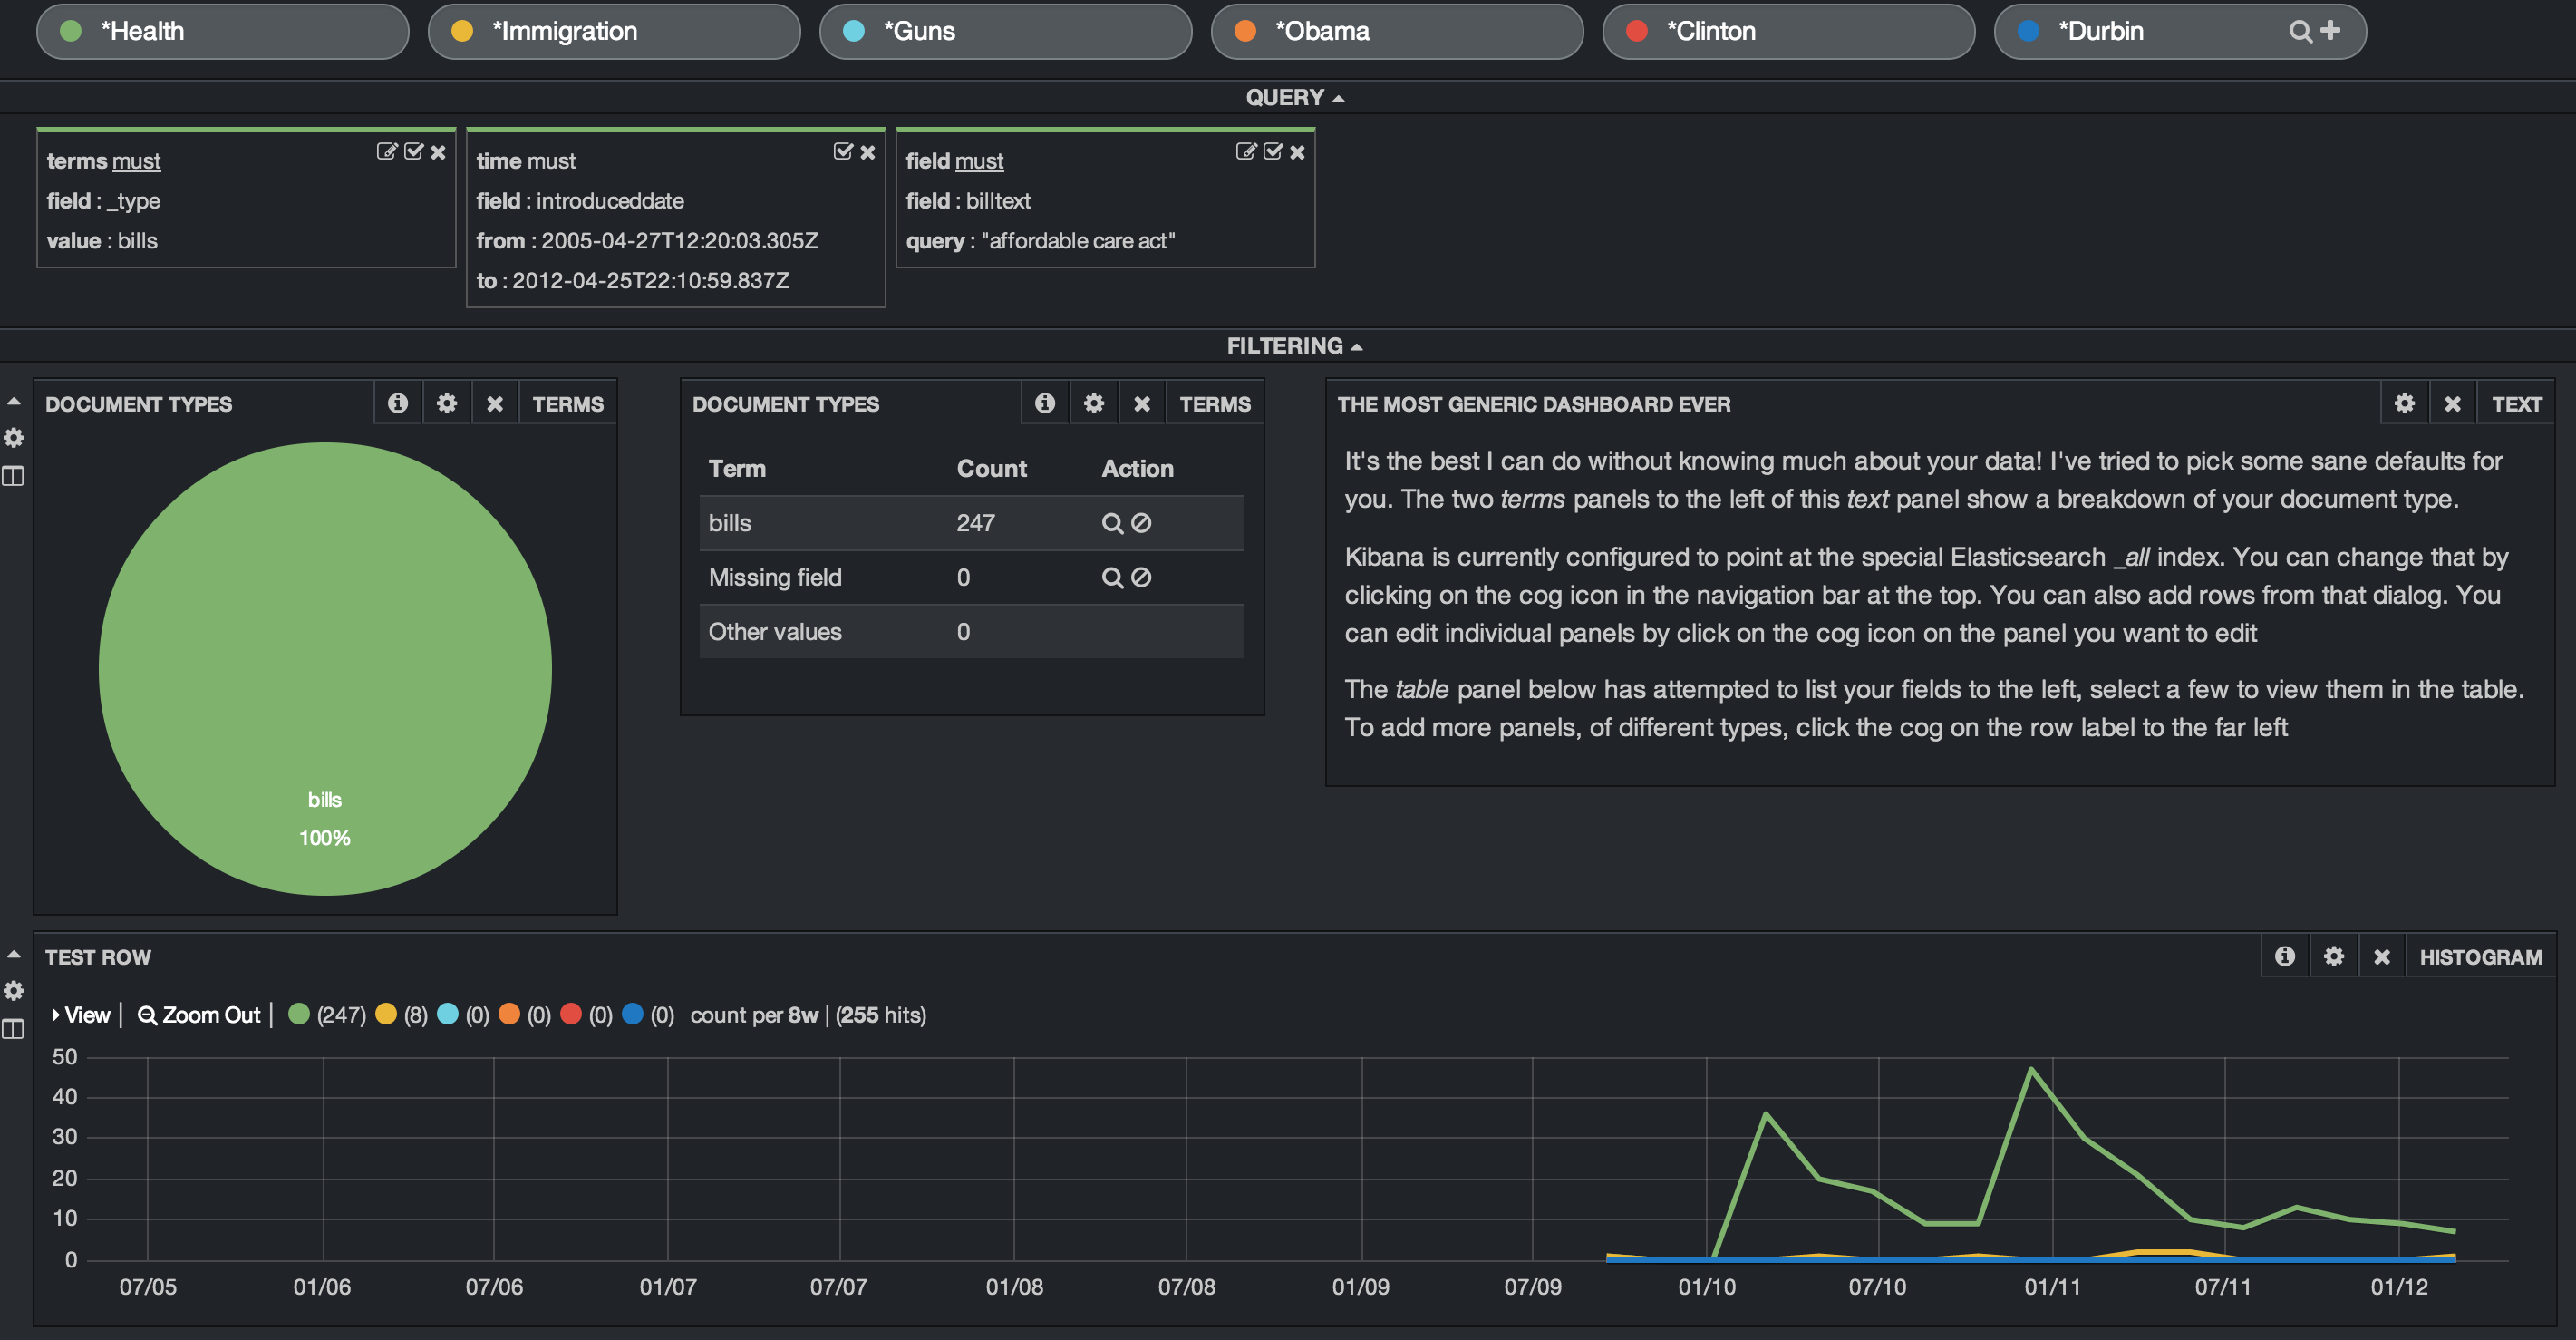
In order to see this over time, we need to add a row and a Histogram panel. In setting up the panel, we set the timefield to the search field “introduceddate”, adjusted the chart settings to show line, legend, x and y axis legends and then choose an interval. I choose an 8 week interval. Once this is added, the histogram will show the bills mentioning the term “Affordable Health Care” in relation to the other search terms. In our example, we see the first mention begin in early 2010 and various bills introduced over the next two years. We also see that the term “immigration” shows up in 8 bills and none of the other search terms appear at all.
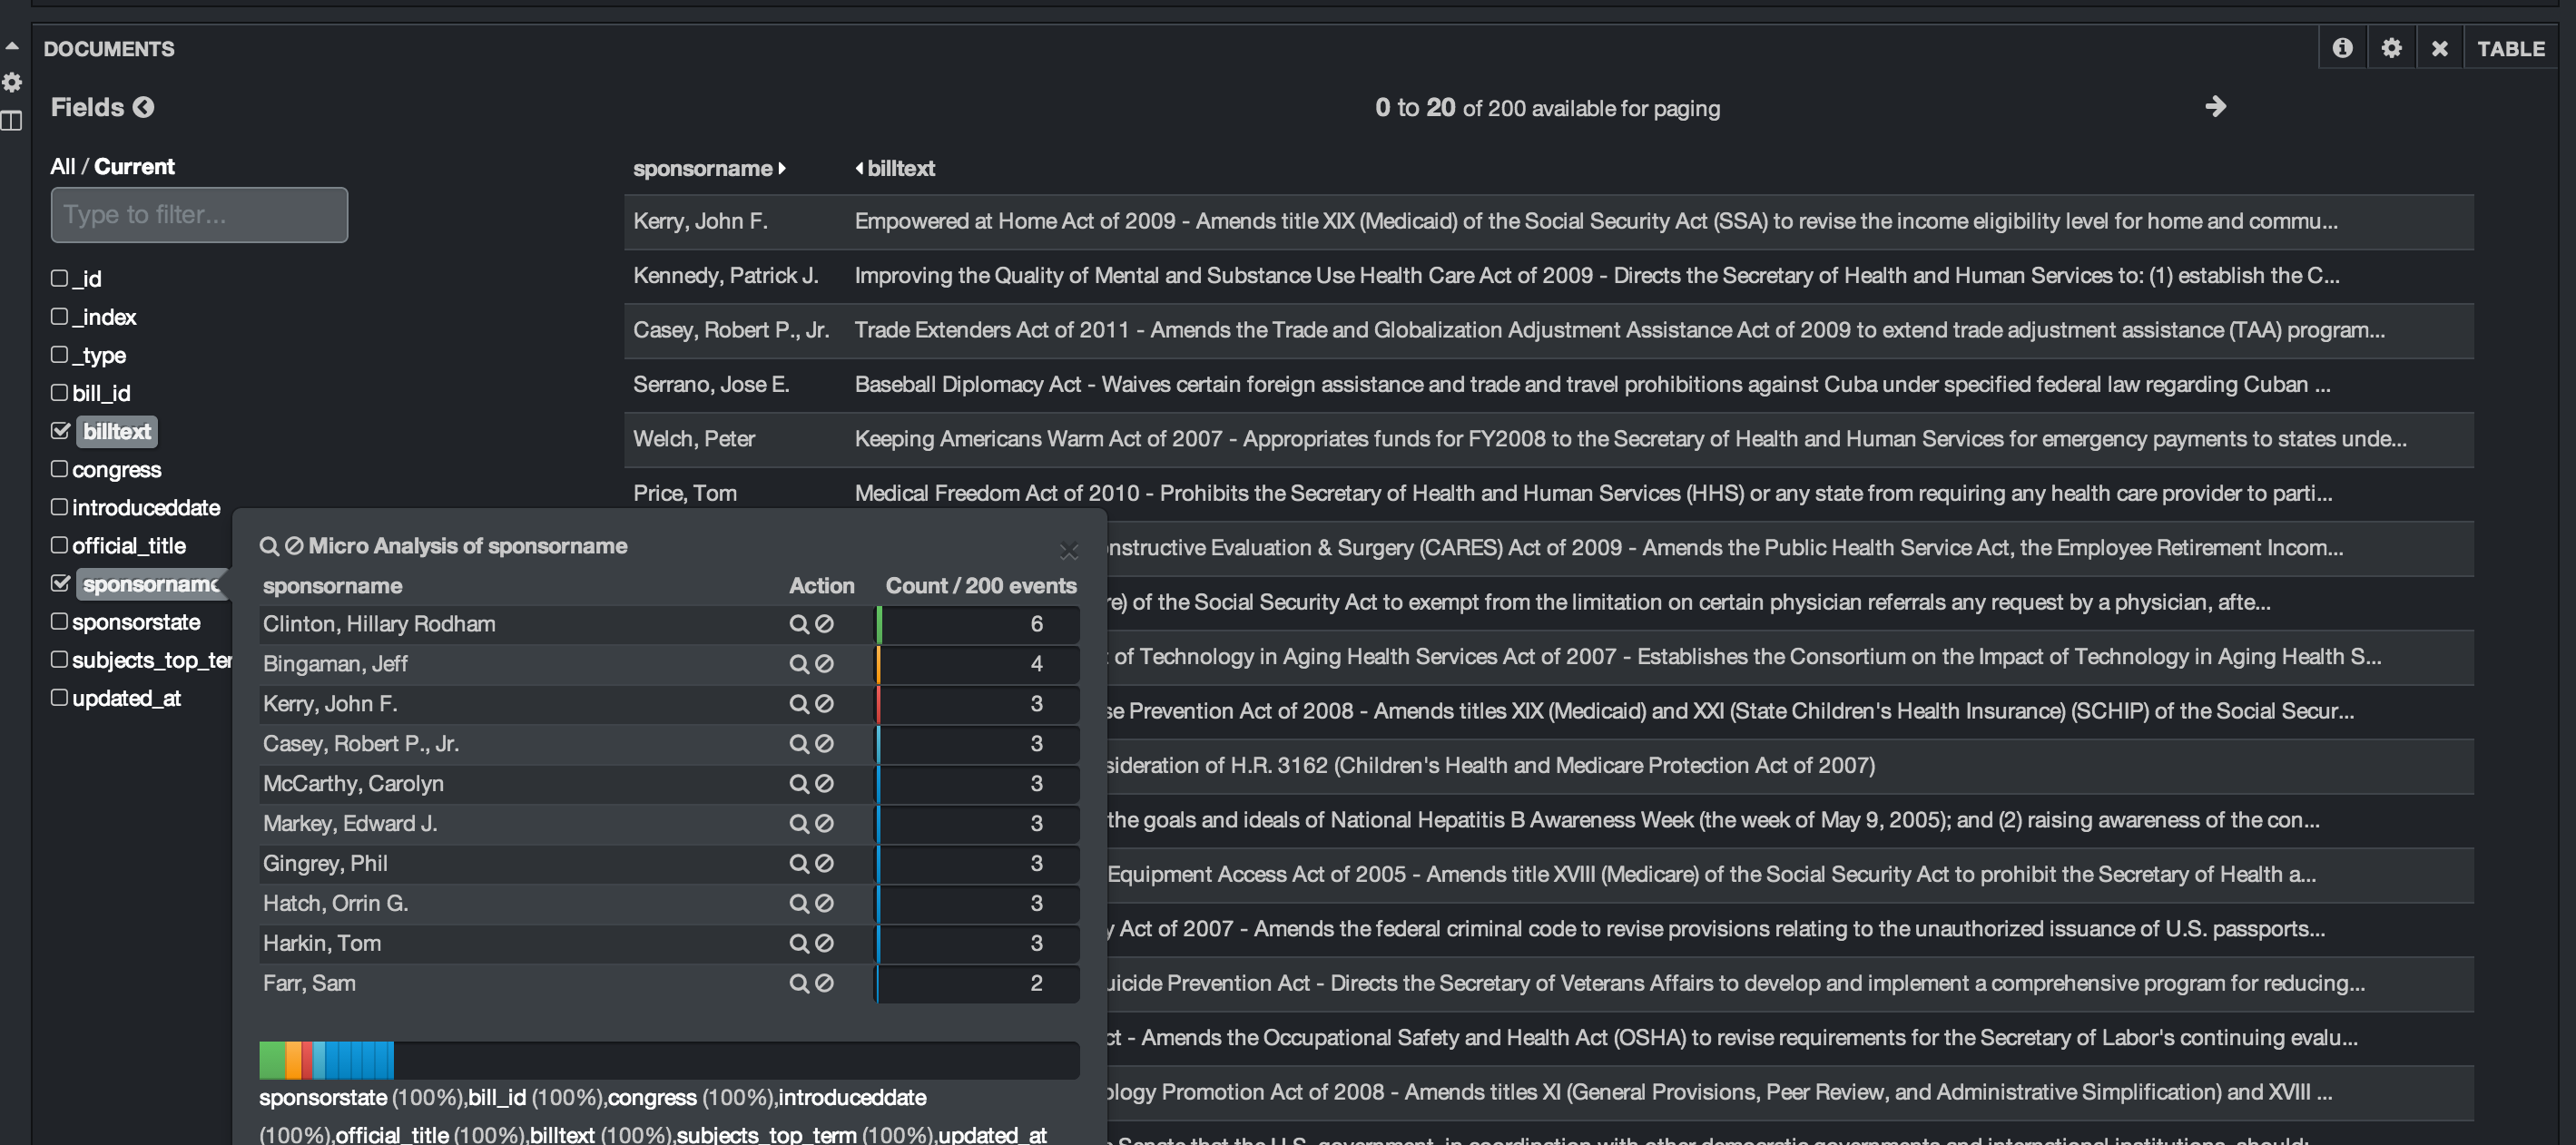
Down below, we add a table panel to allow us to see details from the raw records. We can look at the sponsor, bill text, and other values. Kibana allows us to expand each record, look at the data in raw, json or table format and allows you to select which columns to view. We can also run a quick histogram on any of the fields as shown below. Here I clicked on the bill sponsor to see who is the most common sponsor.
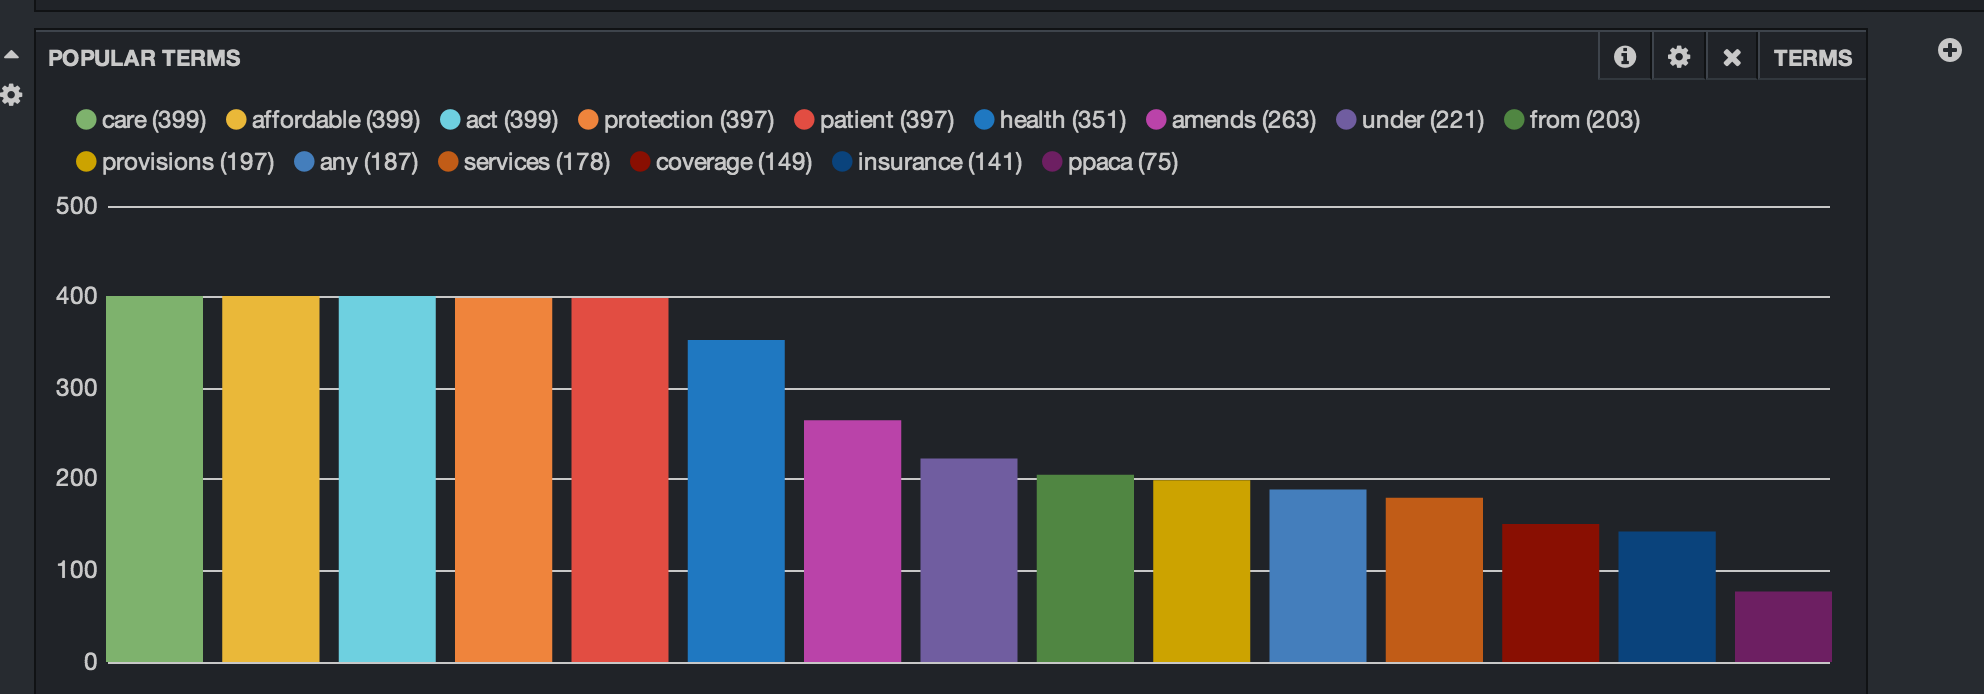
We’ll add one other panel. This is the Popular Terms panel. This shows us by count the most popular terms in the filtered result set. Kibana allows you to exclude terms and set the display as either bar chart, pie chart or a table.
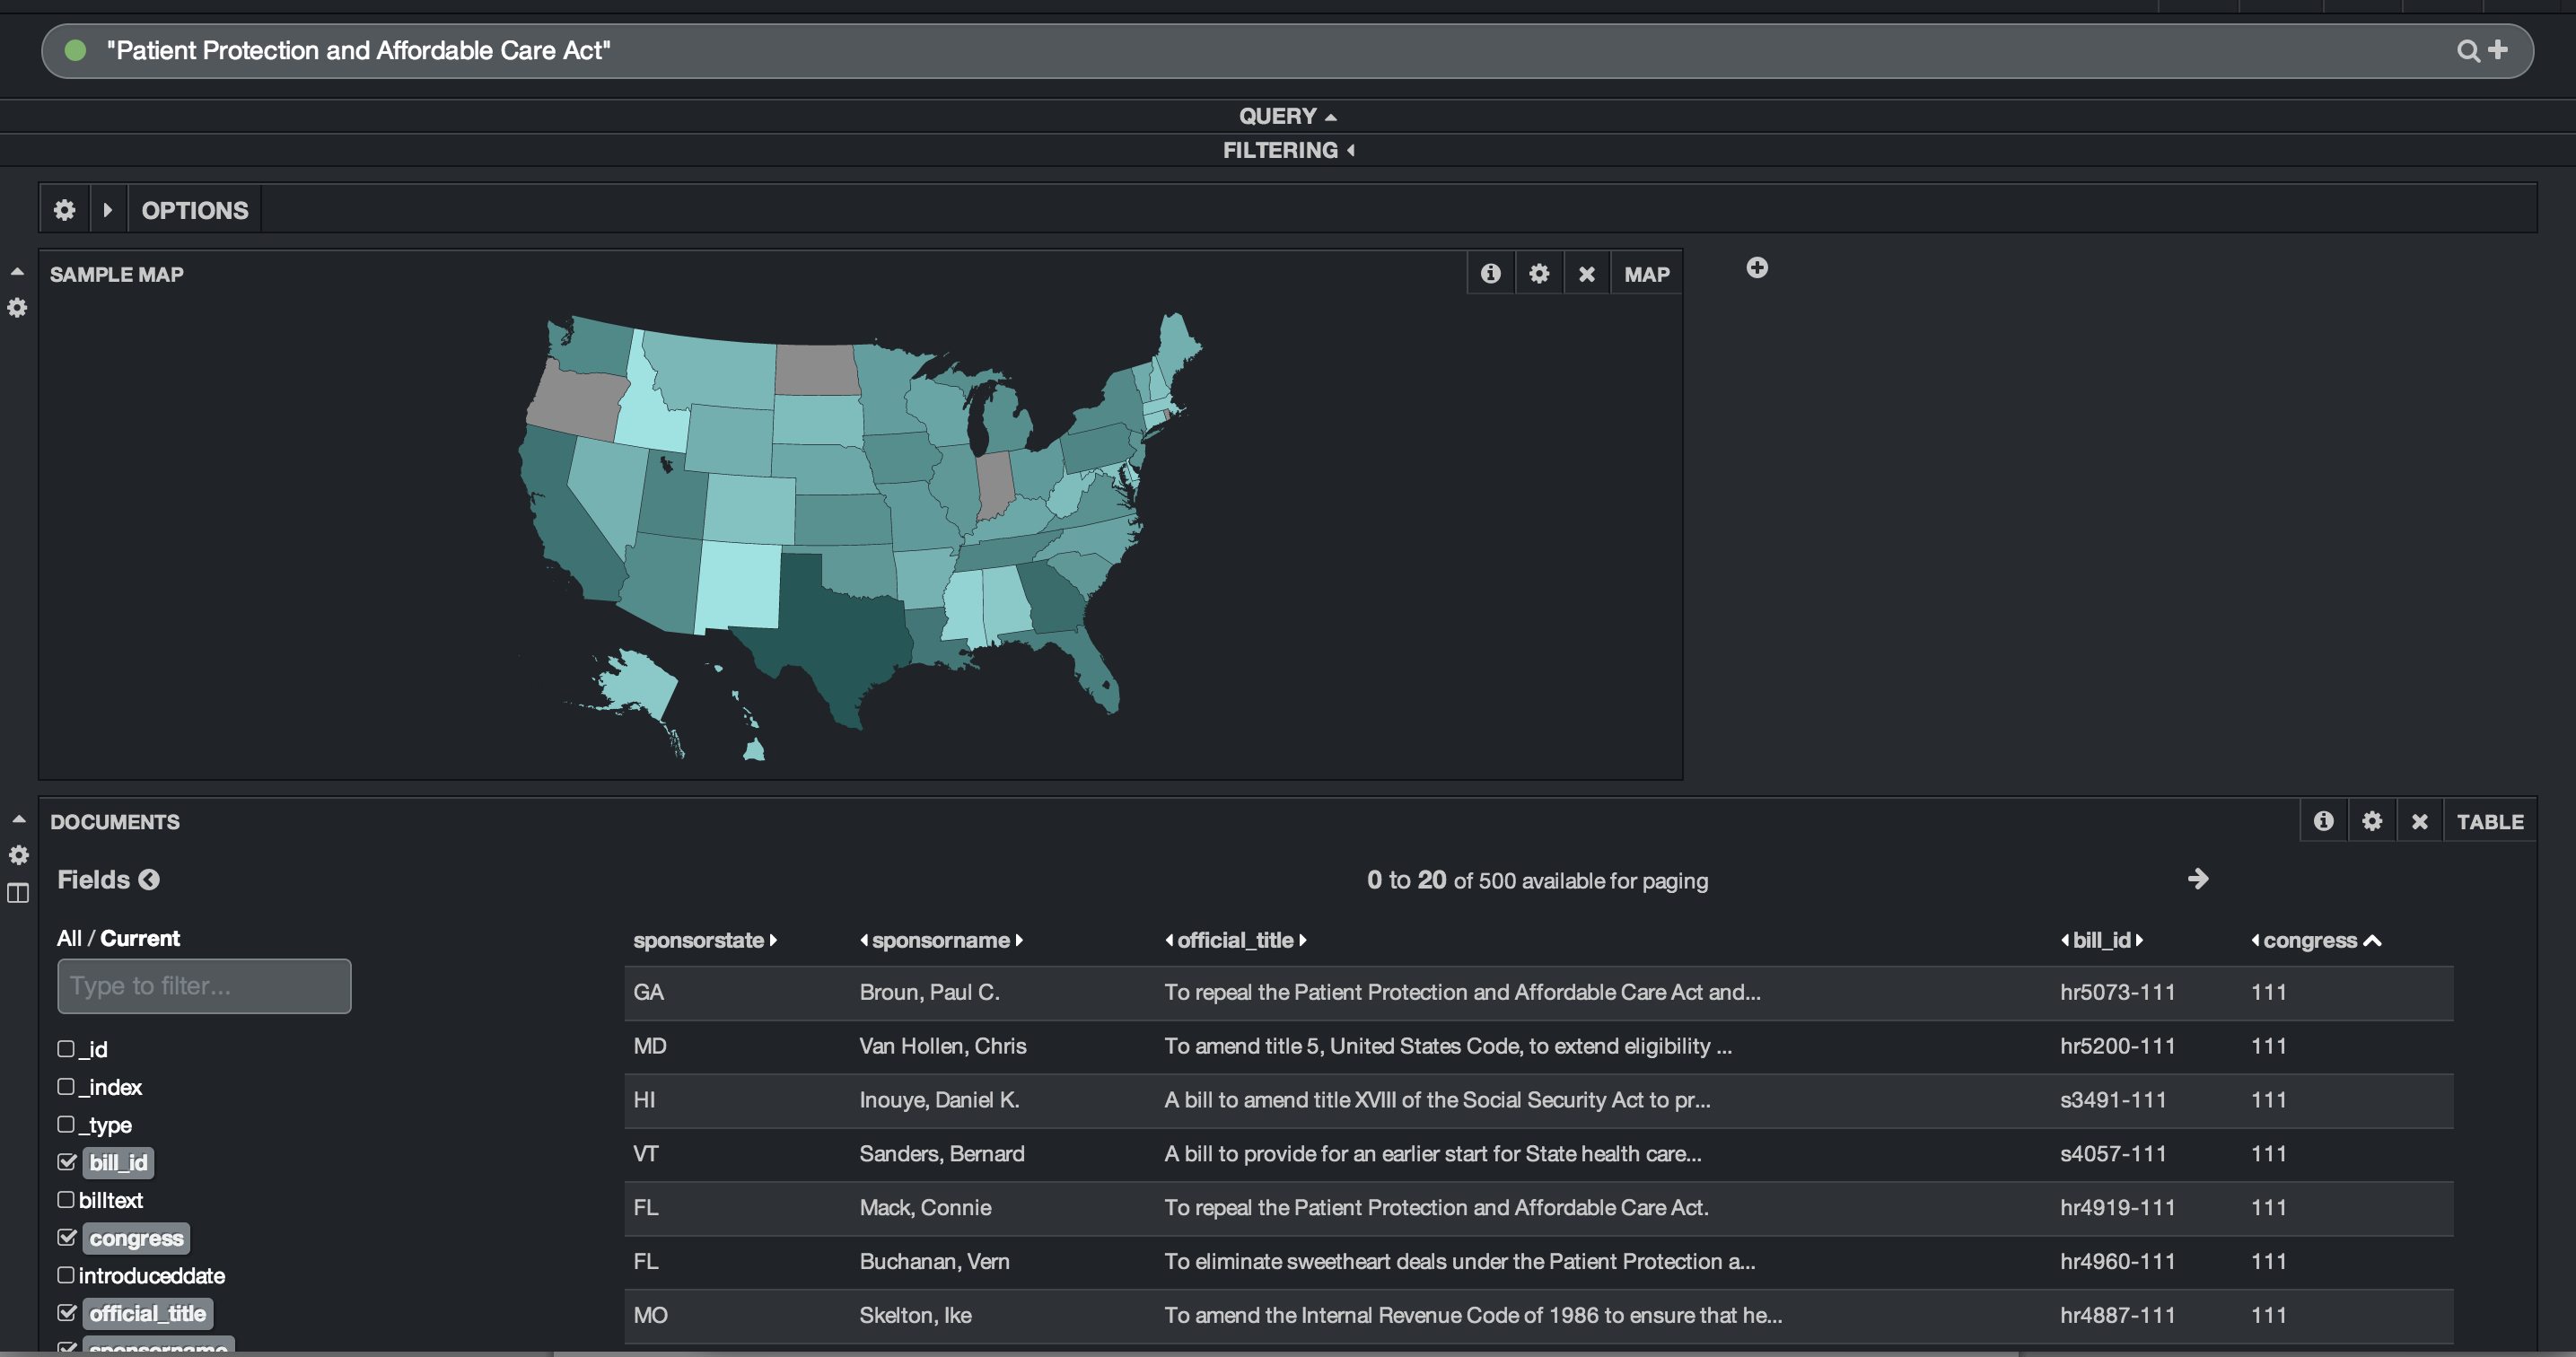
I created another quick dashboard that queries for the term “Patient Protection and Affordable Care Act”. I added a row to the dashboard and added a map panel. The map panel allows you to choose between a world map, US map or European map. Linking the US map to the ‘sponsorstate’ field, I am quickly able to see where the most bills were sponsored that discussed “Patient Protection and Affordable Care Act”. I can also see that Oregon, North Dakota and Indiana had no sponsors. That dashboard is below:
Kibana Dashboard for FBO data
Kibana allows you to create different dashboards for different data sets. I’ll create a dashboard for the FBO data and do some similar queries. The first step is to create the queries for “sole source”, “small business”, “research and development”, “medical care” and “medicare”. I created a time filter on the contract award date and then set the agency name to the “Bureau of Prisons”. Finally, I added in a histogram to show when these terms showed up in the contract description. “Small business” is by far the most popular of those terms.
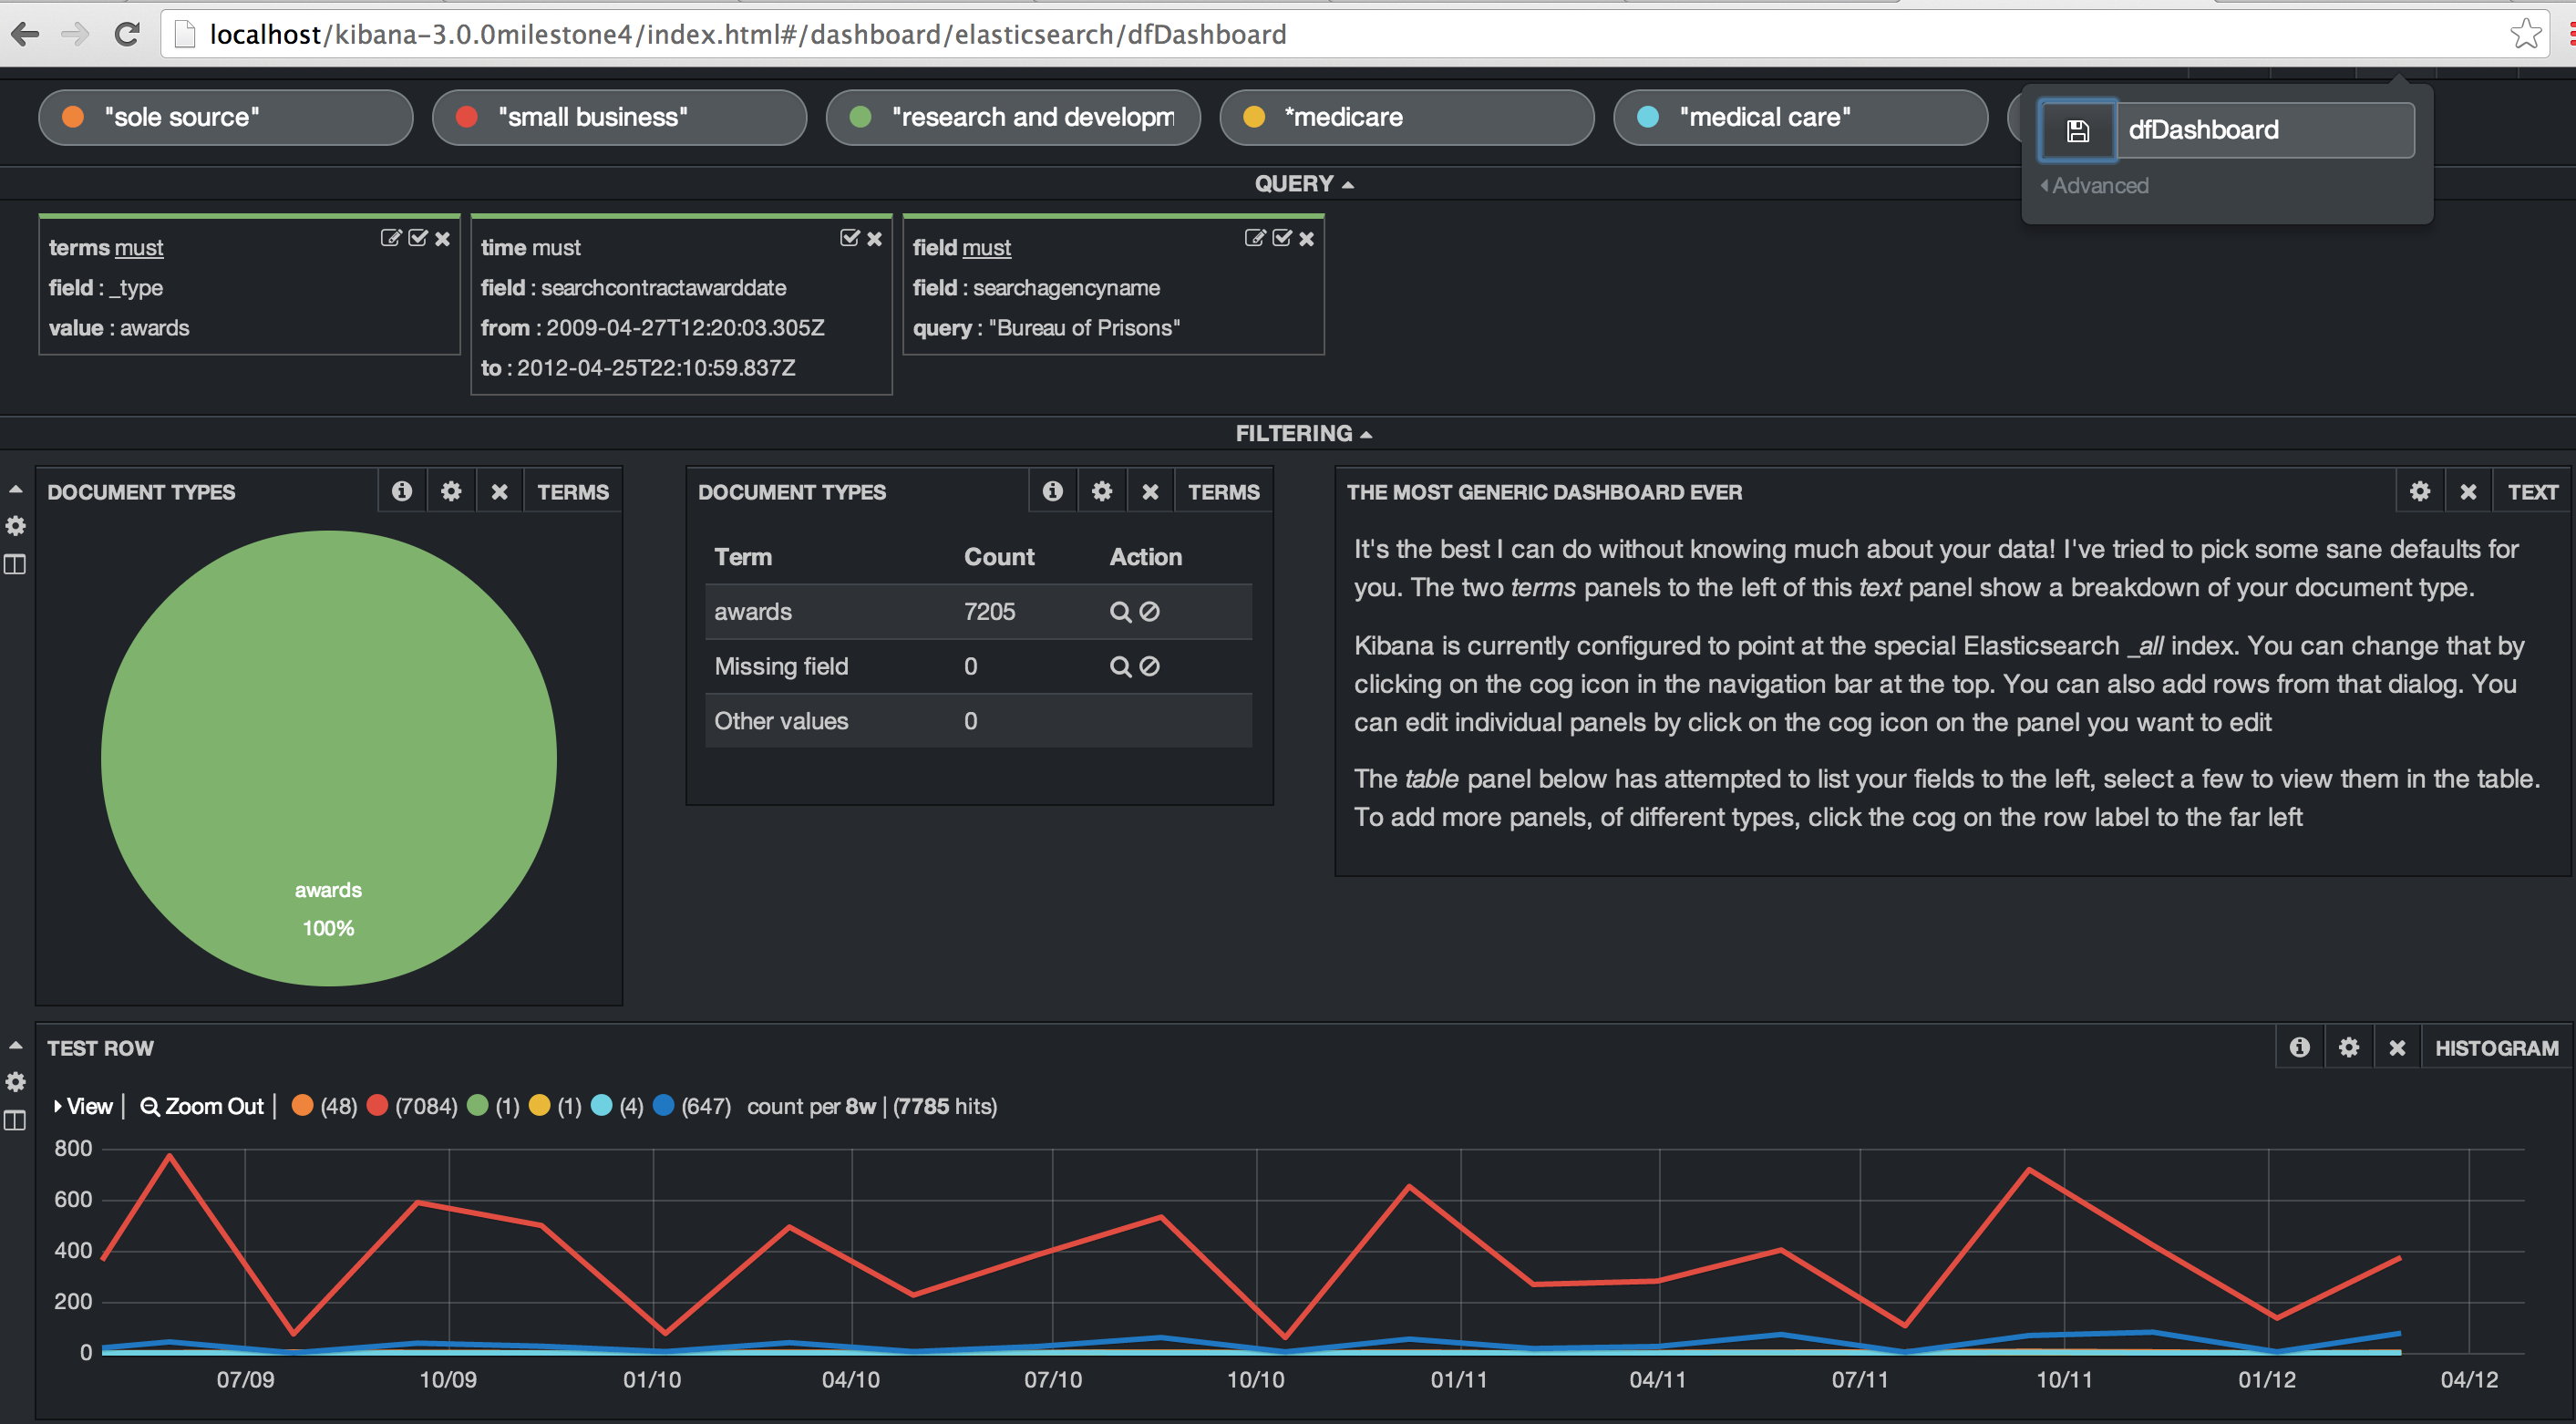
One of the neat things is that you can easily modify the histogram date range. In this case, I’m using an 8 week window but could easily drill in or out. And you can draw a box within the histogram to drill into a specific date range. Again, so much easier and interactive. No need to re-run a job based on new criteria or a new date range.
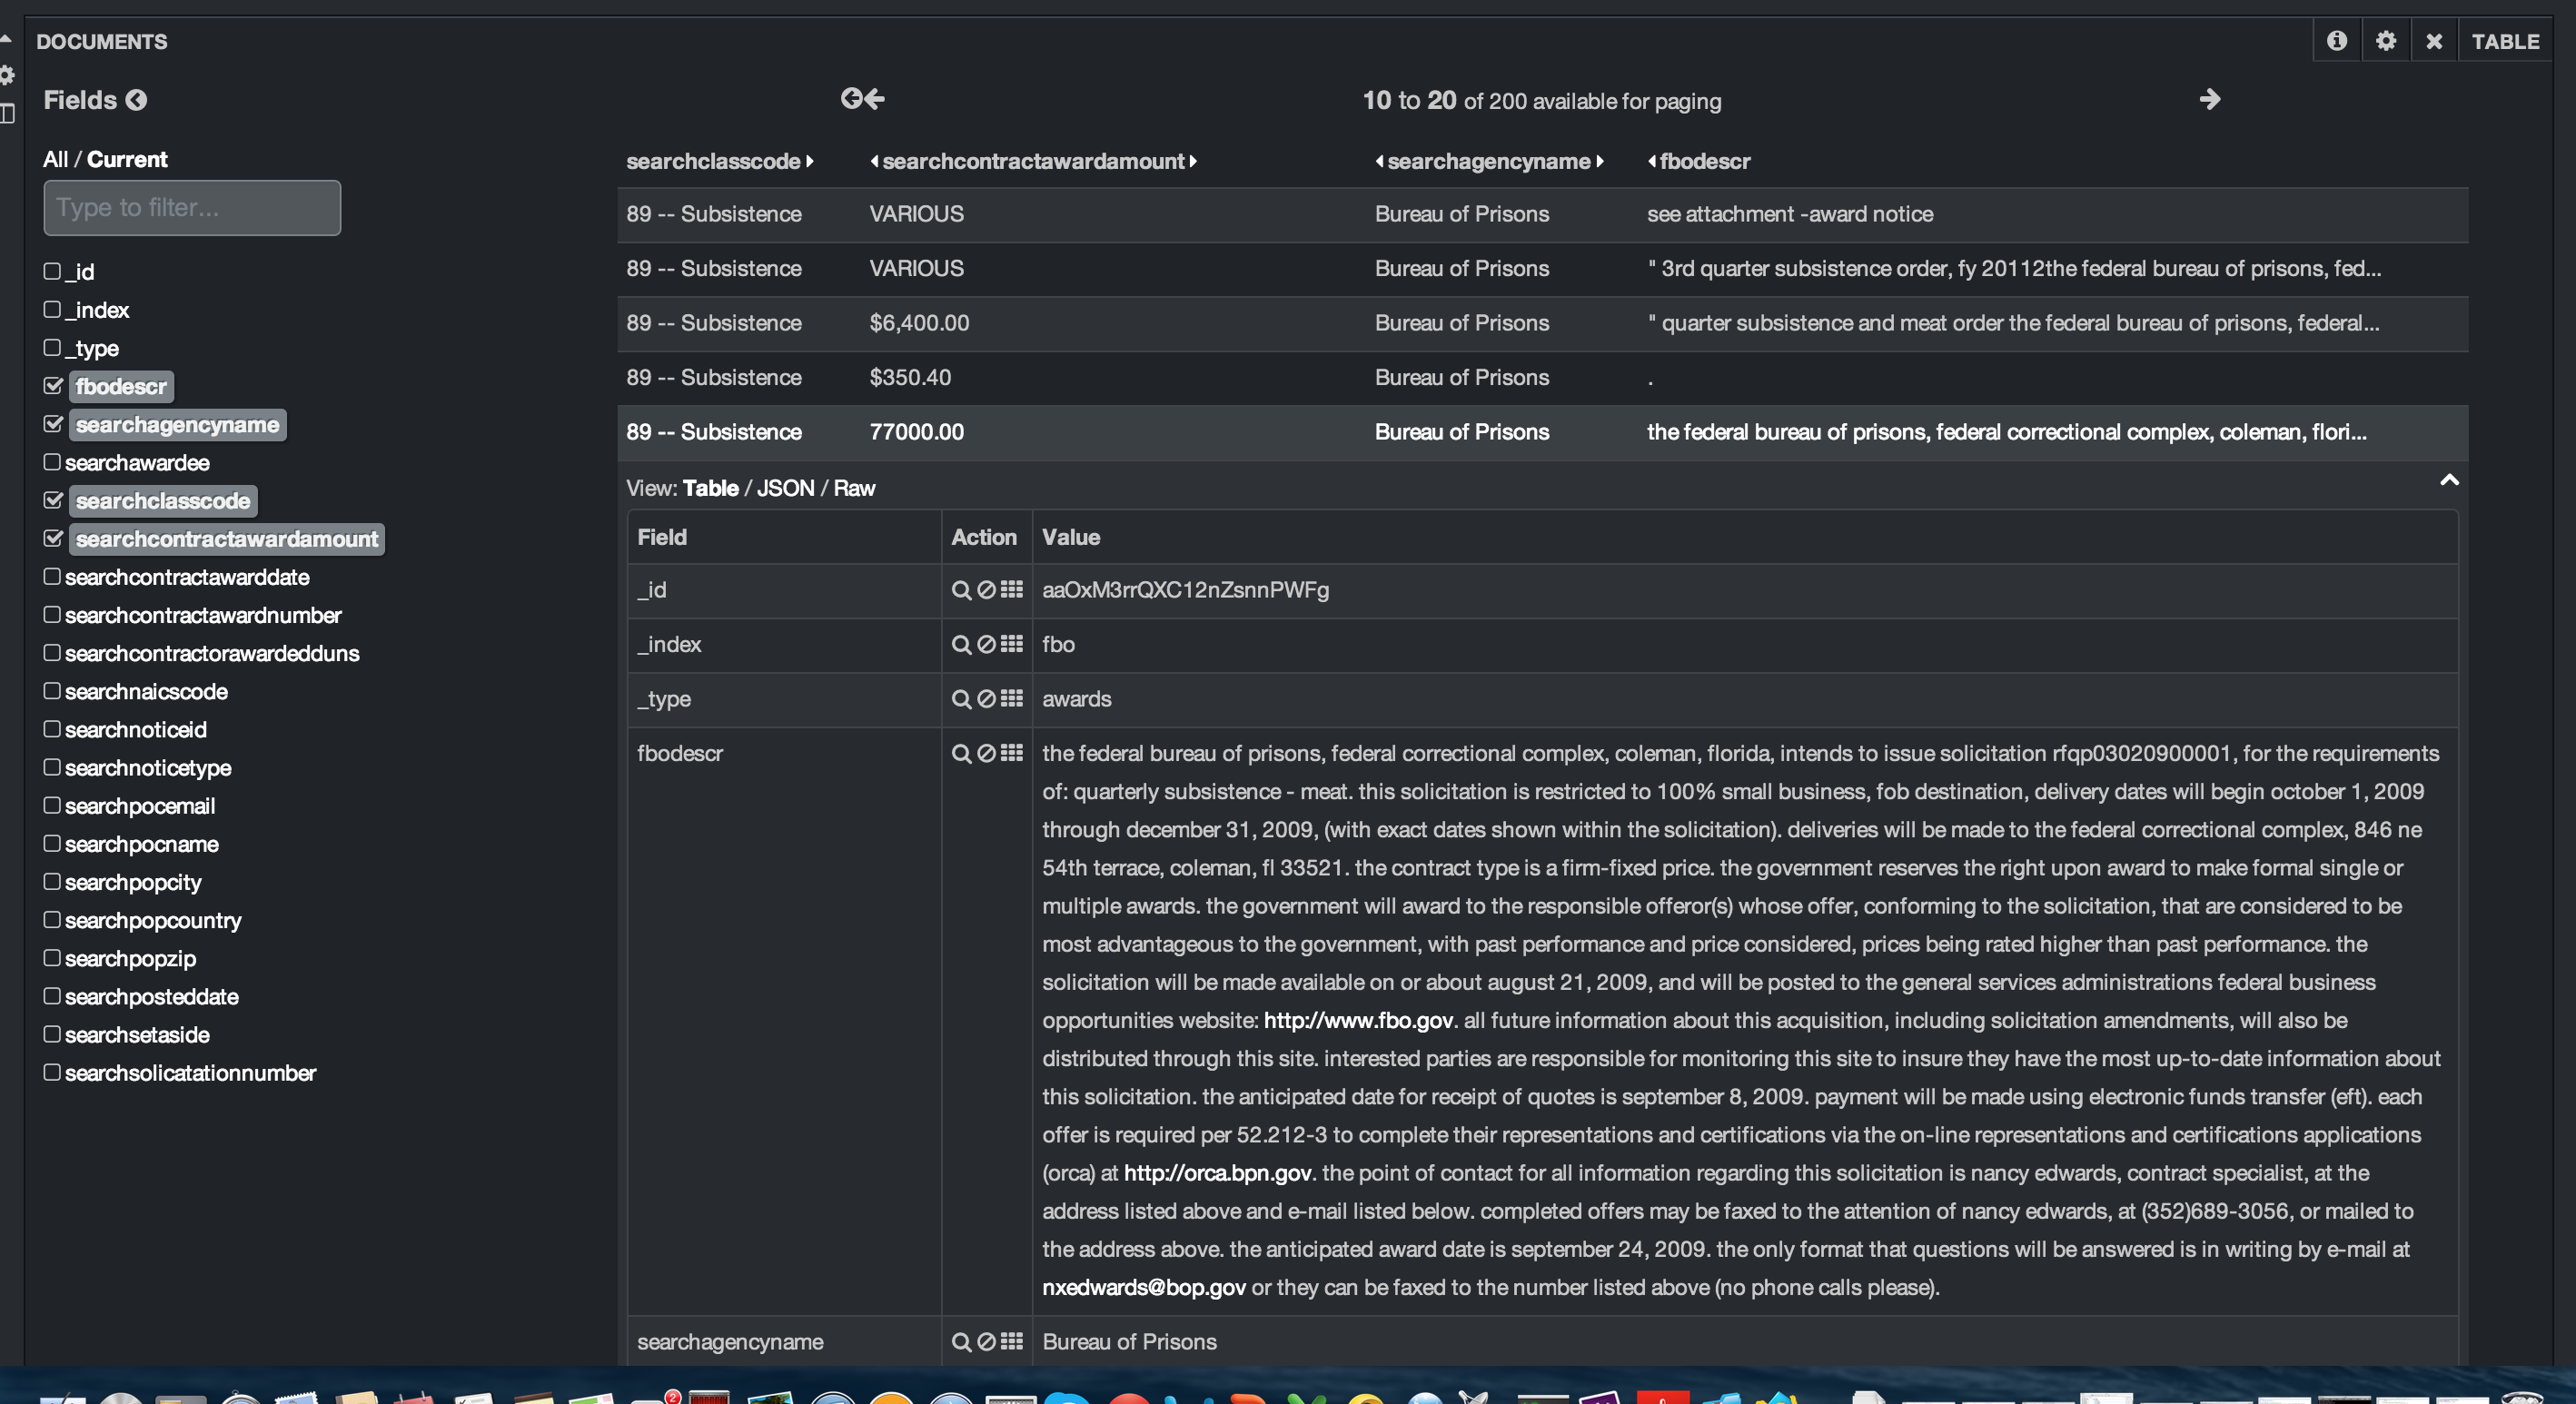
Kibana allows you to page through the results. You can easily modify the number of results and the number of results per page. In this case, I’ve set up 10 results per page with a maximum of 20 pages. You can open each result and see each field’s data in a table, json or raw format.
The so-what
Using Elasticsearch and Kibana with both the FBO and the GovTrack data was great since both had data with a timestamp. While the Elasticsearch stack is normally thought of in the terms of ELK (Elasticsearch, Logstash, and Kibana), using non-logstash data worked out great. Kibana is straight-forward to use and provides the ability to drill down into data easily. You don’t have to configure a data stream or set up a javascript visualization library. All of the heavy lifting is done for you. It is definitely worth your time to check it out and experiment with it.