GraphConnect was held two weeks ago (Nov 5-6) in San Francisco. GraphConnect was put together by Neo4J as an initial conference on graph databases.
Part of the conference was a contest on building innovative graphs. The “Graphies” recognized and celebrated individuals and teams that were developing innovative and impressive graph database applications. Additionally, there was a twitter contest called #ShowMeYourGraph. The contest was to tap into your creative side and show us your most creative graph using any online format: graph visualization, photo, video, blog, etc.
Two of my submissions were SuperPac contributions and SuperPac contributions with labels. The rest of this post will talk about how I created the two charts.
SuperPac Contributions
The Sunlight Foundation provided the SuperPac expenditure data for the 2012 campaign. The data was in a csv format.
For this example, I wanted to look at contributions from September 1 through October 2012 as well as look only at the Presidential candidates. This would show which SuperPacs were funding or opposing candidates. Using some crazy Excel skills, I was able to identify the unique SuperPacs, their support or opposition, and the candidate they were supporting or opposing.
Visualization using D3.js
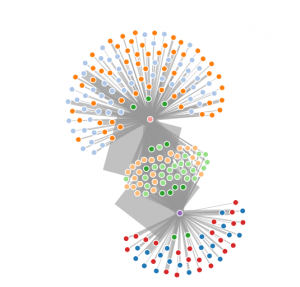
After finding a good example of a force node graph in D3.js, I was able to create the JSON file for the data. In order to create the different colors, I needed to figure out different groupings. The groups for Barack Obama and Mitt Romney were unique groups. Additional groups were created for SuperPacs that supported a candidate, opposed a candidate, supported one candidate while opposing another candidate (i.e. Support Obama and Oppose Romney and vice versa) and those that did all three.
In this instance, Mitt Romney is purple and Barack Obama is the peach node. The red nodes supported Mitt Romney and the blue opposed. The orange nodes opposed Barack Obama and the light blue supported Barack Obama. The green supported Romney and opposed Obama while the light orange supported Obama and opposed Romney.
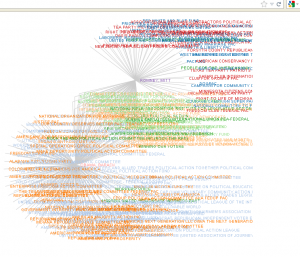
With labels, the graph gets a lot more messy. You can see it here:

Winner
The initial graph was chosen as the winner of the Most Innovative Educational Graph Application as well as a winning entry in the #ShowMeYourGraph contest. Thanks to Neo4J for the conference and for the competition.
