Graph-based search is intelligent: You can ask much more precise and useful questions and get back the most relevant and meaningful information, whereas traditional keyword-based search delivers results that are more random, diluted and low-quality.
With graph-based search, you can easily query all of your connected data in real time, then focus on the answers provided and launch new real-time searches prompted by the insights you’ve discovered.
Recently, I’ve been developing proof-of-concept (POC) demonstrations showing the power of graph-based search with healthcare data. In this series of blog posts, we will implement a data model that powers graph-based search solutions for the healthcare community.
Our first scenario will be to use Neo4j for some simple search and find a provider based on location and/or specialty. As my colleague Max DeMarzi says, “The optimal model is heavily dependent on the queries you want to ask”. Queries that we want to ask are things like: For the State of Virginia, can I find a provider by my location? Where is the nearest pharmacy? Can we break that down by County or by County and Specialty? The queries drive our model. The model that we will use for this scenario and one we will build on later looks like this:
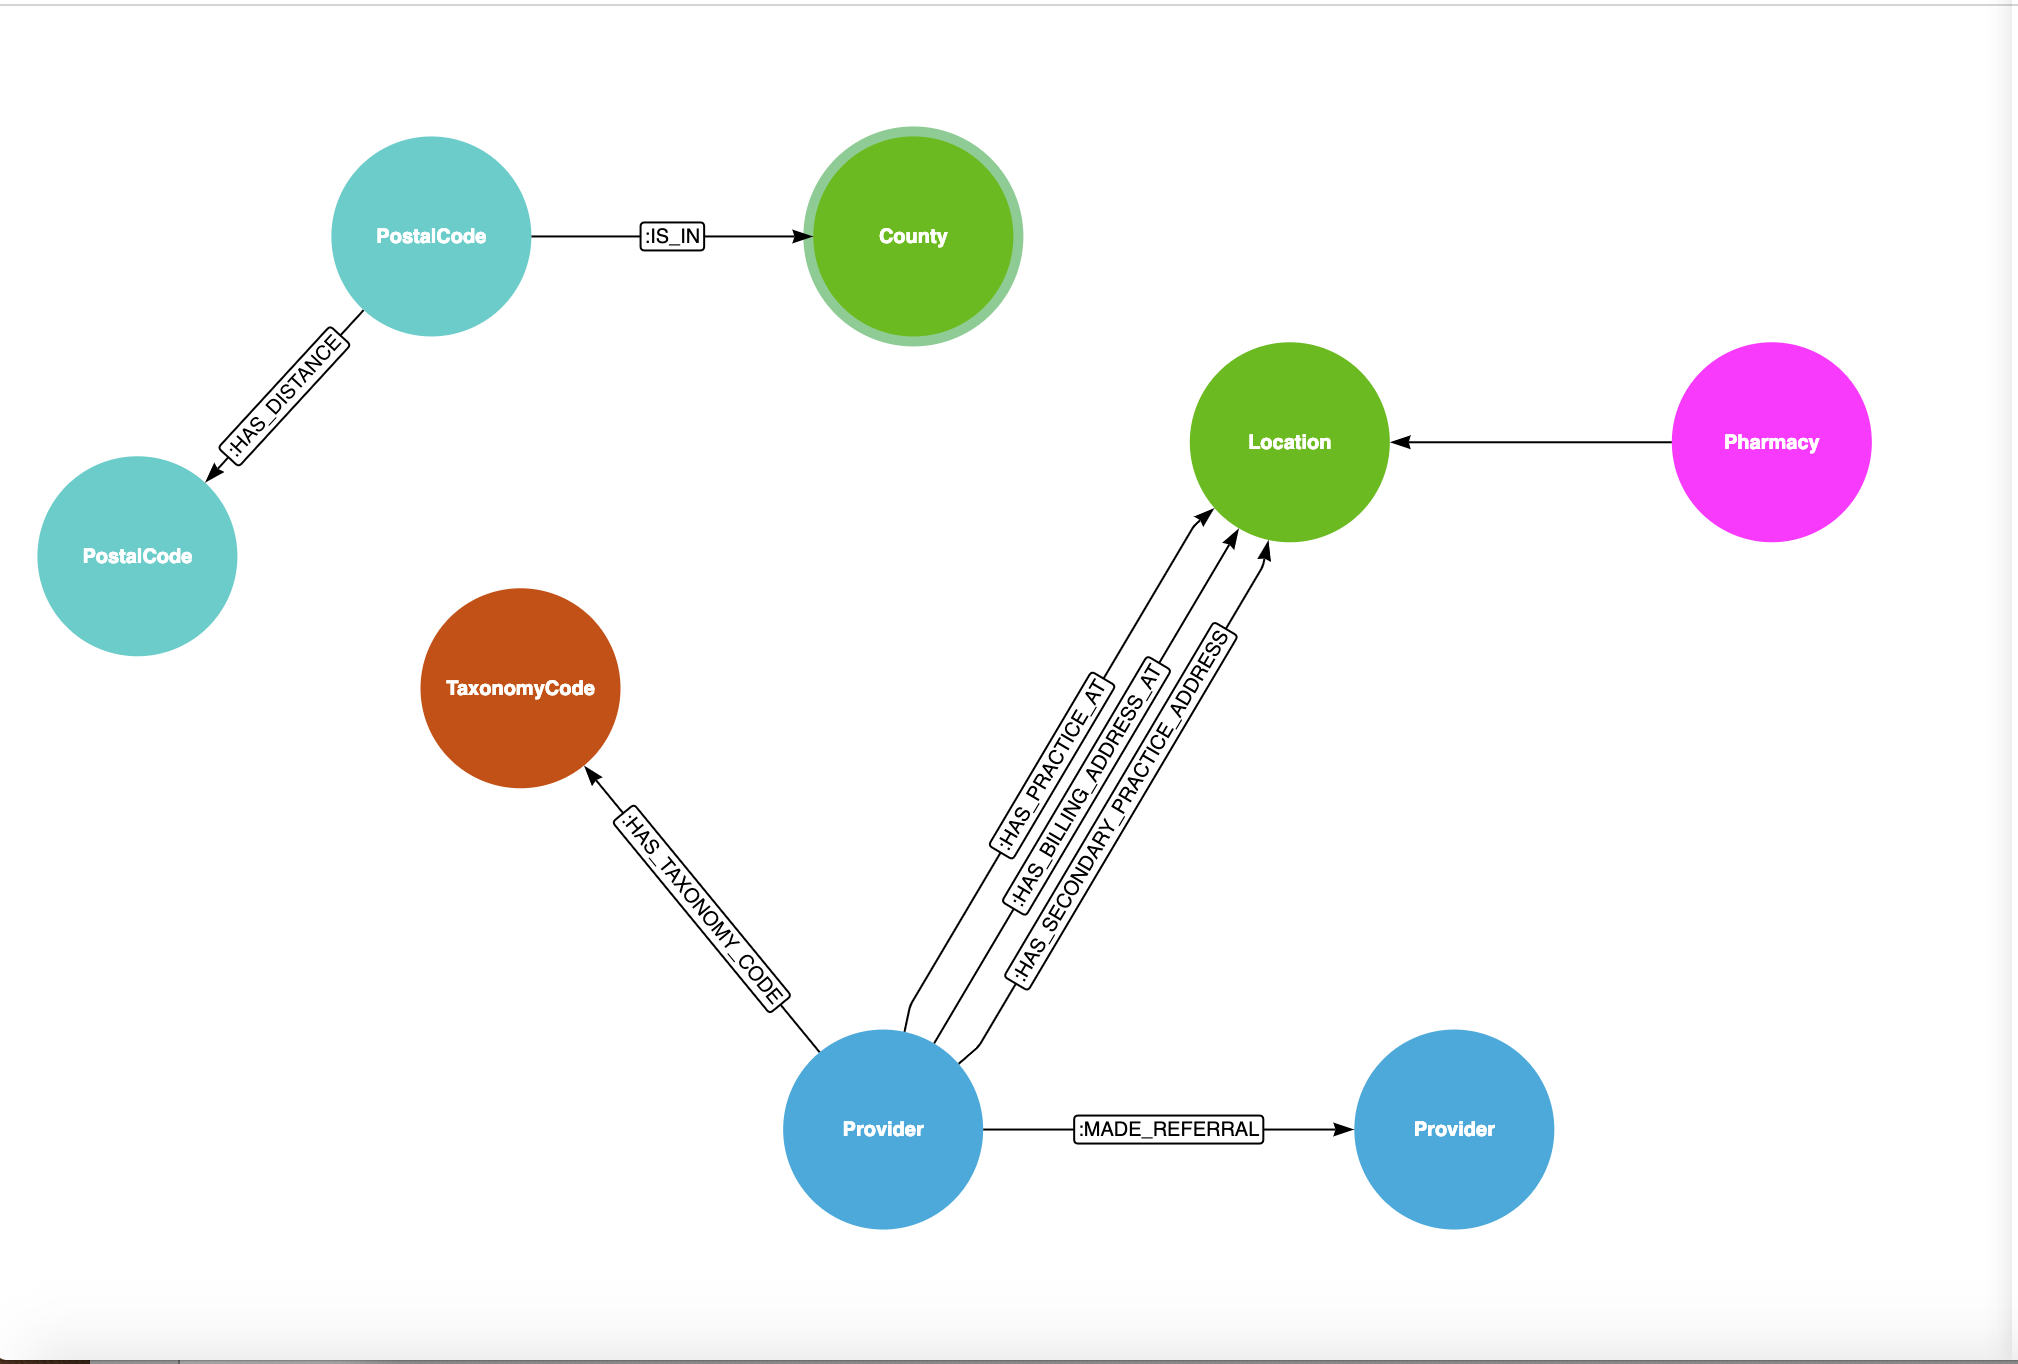
What we see is that there is a Provider who has a Specialty and multiple locations (practice, billing and alternate practice). Postal codes are in a county and postal codes are also a certain distance in miles from each other. We also have loaded the DocGraph Referral/Patient Sharing Data set.
Data Sources
The US Government’s Centers for Medicare and Medicaid Services (CMS) has a whole treasure trove of data resources that we can use to load into Neo4j and use for our POC.
Our first dataset is the NPPES Data Dissemination File. This file contains information on healthcare providers in the US. The key field is the NPI which is a unique 10-digit identification number issued to health care providers in the United States by the CMS.
Our second dataset is a summary spreadsheet showing the number of patients in managed services by county. I’ll use this file to generate patients per county and distribute them across the US.
Our third dataset is the Physician and Other Supplier Public Use File (Physician and Other Supplier PUF). This file provides information on services and procedures provided to Medicare beneficiaries by physicians and other healthcare professionals. The Physician and Other Supplier PUF contains information on utilization, payment (allowed amount and Medicare payment), and submitted charges organized by National Provider Identifier (NPI), Healthcare Common Procedure Coding System (HCPCS) code, and place of service. I’ll use this file for data validation and for building out provider specialties.
Our fourth dataset is the Public Provider Enrollment Data. The Public Provider Enrollment data for Medicare fee-for-service includes providers who are actively approved to bill Medicare or have completed the 855O at the time the data was pulled from the Provider Enrollment and Chain Ownership System (PECOS). These files are populated from PECOS and contain basic enrollment and provider information, reassignment of benefits information and practice location city, state and zip.
Finally, we have a dataset that maps US Counties to US Zip Codes and a dataset that maps the distance between zip codes.
Data Downloads:
You can download the data files from:
NPPES Data Dissemination File
NUCC Taxonomy
Counties to Zip Code / FIPS
Zip Code Tabulation Area
Zip Code Distance
Data Loading
In the next post, I will document the data loading procedures that I wrote for this data.
Additional Information – Public Training (March 2019)
- Introduction to NPI and NPPES
- Introduction to NDC data
- Referral/Patient Sharing Data Tutorial (will cover all versions of the docgraph dataset)
- Open Payments data
Hi Dave,
It is great to see that you have been working in the graph data structure I built over the last three years. The first project that got me into using the Neo4j graph database was doing research in the area of providers to determine their performance levels, and analyzing their referral patterns was very important. You probably saw that I was able to do that much better with the platform you work in. Back then, I was clustering the providers with non-supervised machine learning, and now I can do that work with the Neo4j graph algorithms. It is funny because everything you have done with those data sources, I have taken on, and of course as you know, I have also added in the knowledge graph for the concepts in healthcare which is extremely valuable for the healthcare industry. I also used the Census data initially for putting in the latitude and longitude data, and that was valuable to show good visualizations across our country.
I used the Neo4j Spatial procedures which were useful, but polygrams were not handled well back then in the database.
Based on the work I saw going on with some of your team members, it looks like that will expand in the future. There is geocoding work that needs to be taken on to make sure that we are able to expand this on a weekly basis. Good post and I expect to keep involved in these models that you and I are working on, so let’s keep in touch.